A post by Sam Stockman, PhD student on the Compass programme.
Introduction
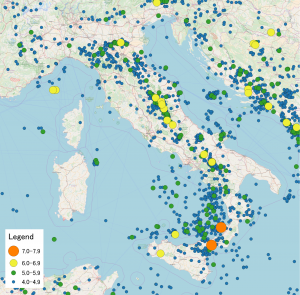
Throughout my PhD I aim to bridge a gap between advances made in the machine learning community and the age-old problem of earthquake forecasting. In this cross-disciplinary work with Max Werner from the School of Earth Sciences and Dan Lawson from the School of Mathematics, I hope to create more powerful, efficient and robust models for forecasting, that can make earthquake prone areas safer for their inhabitants.
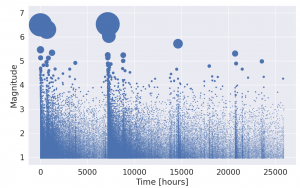
For years seismologists have sought to model the structure and dynamics of the earth in order to make predictions about earthquakes. They have mapped out the structure of fault lines and conducted experiments in the lab where they submit rock to great amounts of force in order to simulate plate tectonics on a small scale. Yet when trying to forecast earthquakes on a short time scale (that’s hours and days, not tens of years), these models based on the knowledge of the underlying physics are regularly outperformed by models that are statistically motivated. In statistical seismology we seek to make predictions through looking at distributions of the times, locations and magnitudes of earthquakes and use them to forecast the future.
Congratulations to Ed Davis who won a poster award as part of the Jean Golding Institute’s Beauty of Data competition.
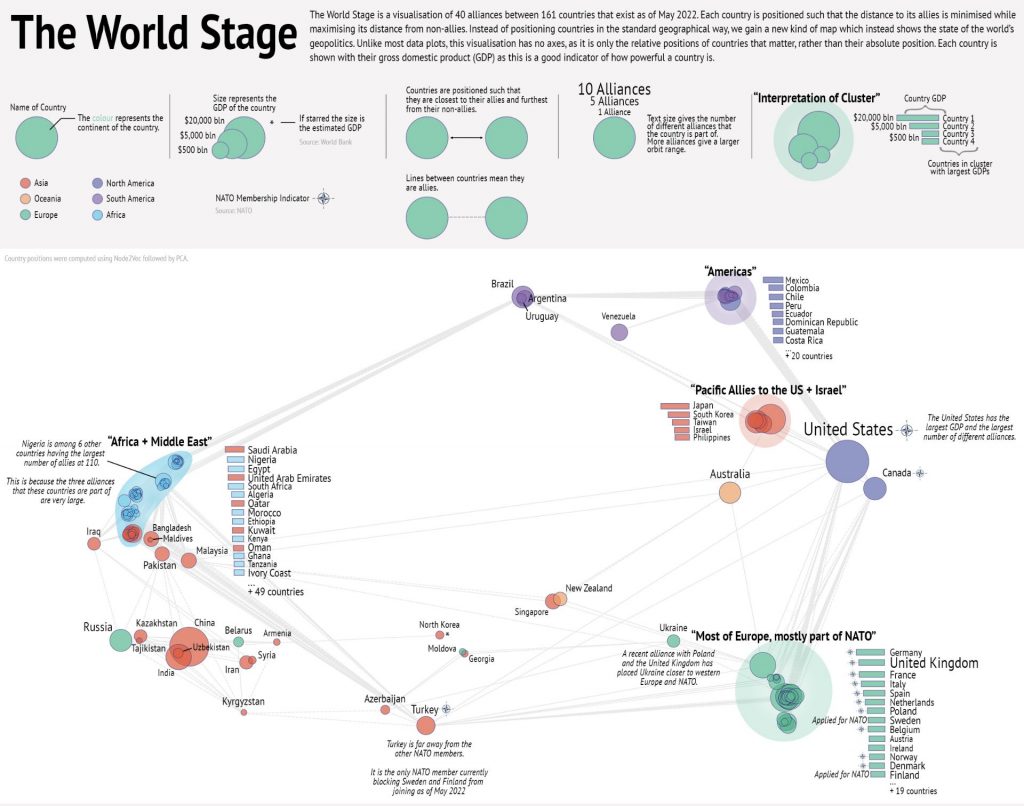
This visualisation, entitled “The World Stage”, gives a new way of representing the positions of countries. Instead of placing them based on their geographical position, they have been placed based on their geopolitical alliances. Countries have been placed such to minimise the distance to their allies and maximise the distance to their non-allies based on 40 different alliances involving 161 countries. This representation was achieved by embedding the alliance network using Node2Vec, followed by principal component analysis (PCA) to reduce it to 2D.
The general focus of my PhD research is in some sense to produce models with the following characteristics:
Well-calibrated (uncertainty estimates from the predictive process reflect the true variance of the target values)
Non-linear
Scalable (i.e. we can run it on large datasets)
At a vague high-level, we can consider that we can have two out of three of those requirements without too much difficulty, but including the third causes trouble. For example, Bayesian linear models would satisfy good-calibration and scalability but (as the name suggests) fail at modelling non-linear functions. Similarly, neural-networks are famously good at modelling non-linear functions and much work has been spent on improving their efficiency and scalability, but producing well-calibrated predictions is a complex additional feature. I am approaching the problem from the angle of Gaussian Processes, which provide well-calibrated non-linear models; at the expense of scalability.
Gaussian Processes (GPs)
See Conor’s blog post for a more detailed introduction to GPs; here I will provide a basic summary of the key facts we need for the rest of the post.
The functional view of GPs is that we define a distribution over functions:
where and are the mean function and kernel function respectively, which play analogous roles to the usual mean and covariance of a Gaussian distribution.
In practice, we only ever observe some finite collection of points, corrupted by noise, which we can hence view as a draw from some multivariate normal distribution:
where
with .
(Here subscript denotes dimensionality of the vector or matrix).
When we use GPs to generate predictions at some new test point we use the following equations which I will not derive here (See [1]) for the predicted mean and variance respectively:
The key point here is that both predictive functions involve the inversion of an matrix at a cost of .
A post by Jack Simons, PhD student on the Compass programme.
Introduction
I began my PhD with my supervisors, Dr Song Liu and Professor Mark Beaumont with the intention of combining their respective fields of research; Density Ratio Estimation (DRE), and Simulation Based Inference (SBI):
DRE is a rapidly growing paradigm in machine learning which (broadly) provides efficient methods of comparing densities without the need to compute each density individually. For a comprehensive yet accessible overview of DRE in Machine Learning see [1].
SBI is a group of methods which seek to solve Bayesian inference problems when the likelihood function is intractable. If you wish for a concise overview of the current work, as well as motivation then I recommend [2].
Last year we released a paper, Variational Likelihood-Free Gradient Descent [3] which combined these fields. This blog post seeks to condense, and make more accessible, the contents of the paper.
Motivation: Likelihood-Free Inference
Let’s begin by introducing likelihood-free inference. We wish to do inference on the posterior distribution of parameters for a specific observation , i.e. we wish to infer which can be decomposed via Bayes’ rule as
The likelihood-free setting is that, additional to the usual intractability of the normalising constant in the denominator, the likelihood, , is also intractable. In lieu of this, we require an implicit likelihood which describes the relation between data and parameters in the form of a forward model/simulator (hence simulation based inference!). (more…)
Between 4th and 8th of April 2022 Compass CDT students are attending APTS Week 2 in Durham.
Academy for PhD Training in Statistics (APTS) organises, through a collaboration between major UK statistics research groups, four residential weeks of training each year for first-year PhD students in statistics and applied probability nationally. Compass students attend all four APTS courses hosted by prestigious UK Universities.
For their APTS Week in Durham Compass students will be attending the following modules:
Applied Stochastic Processes (Nicholas Georgiou and Matt Roberts): This module will introduce students to two important notions in stochastic processes — reversibility and martingales — identifying the basic ideas, outlining the main results and giving a flavour of some of the important ways in which these notions are used in statistics.
Statistical Modelling (Helen Ogden): The aim of this module is to introduce important aspects of statistical modelling, including model selection, various extensions to generalised linear models, and non-linear models.
A post by Conor Newton, PhD student on the Compass programme.
Introduction
My research focuses on designing decentralised algorithms for the multi-agent variant of the Multi-Armed Bandit problem. This research is jointly supervised by Henry Reeve and Ayalvadi Ganesh.
Manyreal-worldoptimisationproblemsinvolverepeatedratherthanone-offdecisions.A decisionmaker(who we refer to as an agent)isrequiredtorepeatedlyperformactionsfroma setofavailableoptions.Aftertakinganaction,theagentwillreceivearewardbasedon the action performed.The agent can then use this feedback to inform later decisions.Some examples of such problems are:
Choosing advertisements to display on a website each time a page is loaded to maximise click-through rate.
Calibrating the temperature to maximise the yield from a chemical reaction.
Distributing a budget between university departments to maximise research output.
Choosing the best route to commute to work.
In each case there is a fundamental trade-off between exploitation and exploration.On the one hand, the agent should act in ways which exploit the knowledge they have accumulated to promote their short term reward, whether that’s the yield of a chemical process or click-throughrateonadvertisements.Ontheotherhand,theagentshouldexplorenewactions inordertoincreasetheirunderstandingoftheirenvironmentinwayswhichmaytranslate into future rewards.(more…)
EPSRC PhD in Computational Statistics and Data Science is now recruiting for its next available fully-funded home fees places to start September 2022.
We will be prioritising applicants who wish to work with the following potential supervisors:
Professor Nicky Welton – Professor Welton works in the the department of Population Health Sciences in the Bristol Medical School. Her work as a Compass supervisor can include supervision in the areas of Medical Statistics and Health Economics, in particular methods for combining evidence from multiple sources to answer healthcare policy questions.
Dr Sidarth Jaggi – Dr Jaggi is an Associate Professor in the Institute of Statistical Science and a Turing Fellow. His Compass PhD supervision can cover areas such as high-dimensional statistics, and robust machine learning.
Dr Rihuan Ke – Dr Ke is a Lecturer in the School of Mathematics. His research is on machine learning and mathematical image analysis. He has been developing statistical learning approaches and data-driven models for solving problems in computation and data science, and in particular for large scale image analysis. The typical approaches that he takes are to combine mathematical structures and statistical knowledge with modern deep learning techniques, to enable automatic analysis of the intrinsic structure of imaging data and exploiting rich information encoded in the data for the underlying tasks. In his projects, he is also interested in relevant applications in material sciences, medical imaging, and remote sensing. He is supervising PhD projects in deep learning, image analysis, and more generally data science.
My work focuses on addressing the growing need for reliable, day-ahead energy demand forecasts in smart grids. In particular, we have been developing structured ensemble models for probabilistic forecasting that are able to incorporate information from a number of sources. I have undertaken this EDF-sponsored project with the help of my supervisors Matteo Fasiolo (UoB) and Yannig Goude (EDF) and in collaboration Christian Capezza (University of Naples Federico II).
Motivation
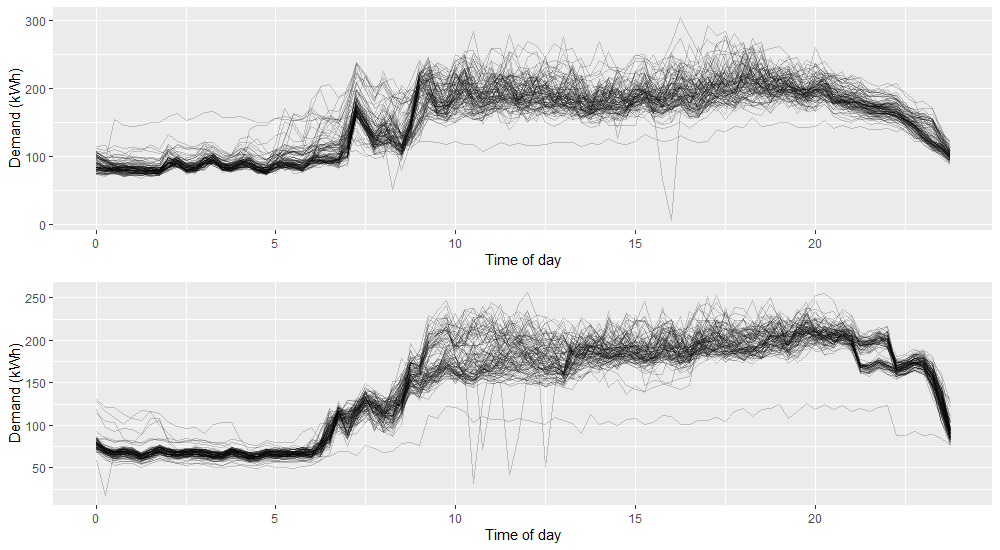
One of the largest challenges society faces is climate change. Decarbonisation will lead to both a considerable increase in demand for electricity and a change in the way it is produced. Reliable demand forecasts will play a key role in enabling this transition. Historically, electricity has been produced by large, centralised power plants. This allows production to be relatively easily tailored to demand with little need for large-scale storage infrastructure. However, renewable methods are typically decentralised, less flexible and supply is subject to weather conditions or other unpredictable factors. A consequence of this is that electricity production will less able to react to sudden changes in demand, instead it will need to be generated in advance and stored. To limit the need for large-scale and expensive electricity storage and transportation infrastructure, smart grid management systems can instead be employed. This will involve, for example, smaller, more localised energy storage options. This increases the reliance on accurate demand forecasts to inform storage management decisions, not only at the aggregate level, but possibly down at the individual household level. The recent impact of the Covid-19 pandemic also highlighted problems in current forecasting methods which struggled to cope with the sudden change in demand patterns. These issues call attention to the need to develop a framework for more flexible energy forecasting models that are accurate at the household level. At this level, demand is characterised by a low signal-to-noise ratio, with frequent abrupt changepoints in demand dynamics. This can be seen in Figure 1 below.
Figure 1: Demand profiles for two different customers. Portuguese smart meter data [4].
The challenges posed by forecasting at a low level of aggregation motivate the use of an ensemble approach that can incorporates information from several models and across households. In particular, we propose an additive stacking structure where we can borrow information across households by constructing a weighted combination of experts, which is generally referred to as stacking regressions [2].
As we start 2022, we look back at our Compass achievements over 2021…
Invited speakers and seminars
Over the course of the year we invited seminar speakers Ingmar Schuster on kernel methods, Nicolas Chopin offered a two-part lecture on sequential Monte Carlo samplers, Ioannis Kosmidis on reducing bias in estimation and a special two-part lecture from Barnett Award winning Jonty Rougier on Wilcoxon’s Two Sample Test.
Compass student launches PAI-Link
In May, Compass PhD student, Mauro Camara Escudero, set up PAI-Link: a nation-wide AI postgraduate seminar series.
We ran training sessions on themes such as interdisciplinary research, responsible innovation and a Hackathon run with Compass partners LV= General Insurance, which is recounted by Doug Corbin in his blog post. Compass held its first Science Focus Lab on multi-omics data and cancer treatment with colleagues from Bristol Integrative Epidemiology unit.
Five Compass students were recruited to internships with organisations such as Microsoft Research, Adarga, CheckRisk, Afiniti and Shell.
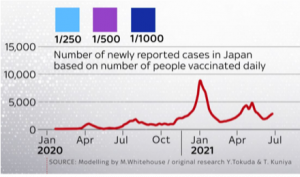
Michael Whitehouse contributed to a Sky News report on the potential impact of the pandemic on the Tokyo Olympics by modelling the rise of COVID-19 cases in Japan.
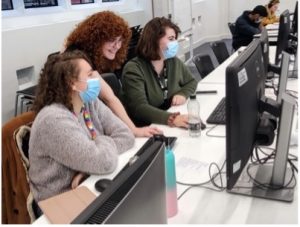
Access to Data Science
Compass ran its first Access to Data Science event – an immersive experience for prospective PhD students which aimed to increase diversity amongst data science researchers by encouraging participants such as women and members of the LGBTQ+ and BAME communities to join us.
Annie Gray presented her paper ‘Matrix factorisation and the interpretation of geodesic distance’ at NeurIPS 2021. Conor Newton gave a talk at a workshop in conjunction with ACM Sigmetrics 2021 and he and Dom Owens won the poster session of the Fry Statistics Conference. Jack Simons paper ‘Variational Likelihood-Free Gradient Descent’ was accepted at AABI 2022. Alex Modell’s paper ‘A Graph Embedding Approach to User Behavior Anomaly Detection’ was accepted to IEEE Big Data Conference 2021. Danny Williams and supervisor Song Liu were awarded an EPSRC Impact Acceleration Account for their project in collaboration with Adarga.
A post by Conor Crilly, PhD student on the Compass programme.
Introduction
This project investigates uncertainty quantification methods for expensive computer experiments.It is supervised by Oliver Johnson of the University of Bristol, and is partially funded by AWE.
Outline
Physical systems and experiments are commonly represented, albeit approximately, using mathematical models implemented via computer code.This code, referred to as a simulator, often cannot be expressed in closed form, and is treated as a ‘black-box’.Such simulators arise in a range of application domains, for example engineering, climate science and medicine.Ultimately, we are interested in using simulators to aid some decision making process.However, for decisions made using the simulator to be credible, it is necessary to understand and quantify different sources of uncertainty induced by using the simulator. Running the simulator for a range of input combinations is what we call a computer experiment [1].As the simulators of interest are expensive, the available data is usually scarce.Emulation is the process of using a statistical model (an emulator) to approximate our computer code and provide an estimate of the associated uncertainty.
Intuitively, an emulator must possess two fundamental properties
It must be cheap, relative to the code
It must provide an estimate of the uncertainty in its output
A common choice of emulator is the Gaussian process emulator, which is discussed extensively in [2] and described in the next section.
Types of Uncertainty
There are many types of uncertainty associated with the use of simulators including input, model and observational uncertainty.One type of uncertainty induced by using anexpensivesimulator is code uncertainty, described by Kennedy and O’Hagan in their seminal paper on calibration [3].To paraphrase Kennedy and O’Hagan:In principle the simulator encodes a relationship between a set of inputs and a set of outputs, which we could evaluate for any given combination of inputs.However, in practice, it is not feasible to run the simulator for every combination, so acknowledging the uncertainty in the code output is required.(more…)

 \sim \mathcal{GP}(m(\cdot),k(\cdot, x))")
 and
and  are the mean function and kernel function respectively, which play analogous roles to the usual mean and covariance of a Gaussian distribution.
")
 + \epsilon_n") with
with ") .
. denotes dimensionality of the vector or matrix).
 we use the following equations which I will not derive here (See [1]) for the predicted mean and variance respectively:
 = k(x_\star,X)K_\epsilon^{-1}y_n")
 = k(x_\star, x_\star) - k(x_\star, X)K_\epsilon^{-1}k(X,x_\star)")
 matrix at a cost of
 ") .
. for a specific observation
  , i.e. we wish to infer
 ") which can be decomposed via Bayes’ rule as
which can be decomposed via Bayes’ rule as = \frac{p(x_{\mathrm{obs}}|\theta)p(\theta)}{\int p(x_{\mathrm{obs}}|\theta)p(\theta) \mathrm{d}\theta}.")
") , is also intractable. In lieu of this, we require an implicit likelihood which describes the relation between data
, is also intractable. In lieu of this, we require an implicit likelihood which describes the relation between data  and parameters

 Hackathon run with Compass partners LV= General Insurance, which is recounted by Doug Corbin in his