Student Perspectives: Semantic Search

A post by Ben Anson, PhD student on the Compass programme.

Semantic Search

Semantic search is here. We already see it in use in search engines [13], but what is it exactly and how does it work?

Search is about retrieving information from a corpus, based on some query. You are probably using search technology all the time, maybe $\verb|ctrl+f|$, or searching on google. Historically, keyword search, which works by comparing the occurrences of keywords between queries and documents in the corpus, has been surprisingly effective. Unfortunately, keywords are inherently restrictive – if you don’t know the right one to use then you are stuck.

Semantic search is about giving search a different interface. Semantic search queries are provided in the most natural interface for humans: natural language. A semantic search algorithm will ideally be able to point you to a relevant result, even if you only provided the gist of your desires, and even if you didn’t provide relevant keywords.

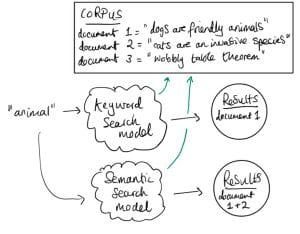
Figure 1: Illustration of semantic search and keyword search models

Figure 1 illustrates a concrete example where semantic search might be desirable. The query ‘animal’ should return both the dog and cat documents, but because the keyword ‘animal’ is not present in the cat document, the keyword model fails. In other words, keyword search is susceptible to false negatives.

Transformer neural networks turn out to be very effective for semantic search [1,2,3,10]. In this blog post, I hope to elucidate how transformers are tuned for semantic search, and will briefly touch on extensions and scaling.

The search problem, more formally

Suppose we have a big corpus $\mathcal{D}$ of documents (e.g. every document on wikipedia). A user sends us a query $q$, and we want to point them to the most relevant document $d^*$. If we denote the relevance of a document $d$ to $q$ as $\text{score}(q, d)$, the top search result should simply be the document with the highest score,

$$
d^* = \mathrm{argmax}_{d\in\mathcal{D}}\, \text{score}(q, d).
$$

This framework is simple and it generalizes. For $\verb|ctrl+f|$, let $\mathcal{D}$ be the set of individual words in a file, and $\text{score}(q, d) = 1$ if $q=d$ and $0$ otherwise. The venerable keyword search algorithm BM25 [4], which was state of the art for decades [8], uses this score function.

For semantic search, the score function is often set as the inner product between query and document embeddings: $\text{score}(q, d) = \langle \phi(q), \phi(d) \rangle$. Assuming this score function actually works well for finding relevant documents, and we use a simple inner product, it is clear that the secret sauce lies in the embedding function $\phi$.

Transformer embeddings

We said above that a common score function for semantic search is $\text{score}(q, d) = \langle \phi(q), \phi(d) \rangle$. This raises two questions:

  • Question 1: what should the inner product be? For semantic search, people tend to use the cosine similarity for their inner product.
  •  Question 2: what should $\phi$ be? The secret sauce is to use a transformer encoder, which is explained below.

Quick version

Transformers magically gives us a tunable embedding function $\phi: \text{“set of all pieces of text”} \rightarrow \mathbb{R}^{d_{\text{model}}}$, where $d_{\text{model}}$ is the embedding dimension.

More detailed version

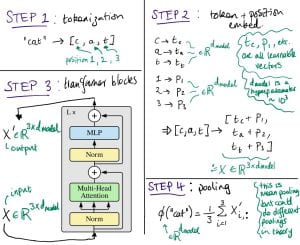
See Figure 2 for an illustration of how a transformer encoder calculates an embedding for a piece of text. In the figure we show how to encode “cat”, but we can encode arbitrary pieces of text in a similar way. The transformer block details are out of scope here; though, for these details I personally found Attention is All You Need [9] helpful, the crucial part being the Multi-Head Attention which allows modelling dependencies between words.


Figure 2: Transformer illustration (transformer block image taken from [6])

The transformer encoder is very flexible, with almost every component parameterized by a learnable weight / bias – this is why it can be used to model the complicated semantics in natural language. The pooling step in Figure 2, where we map our sequence embedding $X’$ to a fixed size, is not part of a ‘regular’ transformer, but it is essential for us. It ensures that our score function $\langle \phi(q), \phi(d) \rangle$ will work when $q$ and $d$ have different sizes.

Making the score function good for search

There is a massive issue with transformer embedding as described above, at least for our purposes – there is no reason to believe it will satisfy simple semantic properties, such as,

$\text{score}(\text{“busy place”}, \text{“tokyo”}) > \text{score}(\text{“busy place”}, \text{“a small village”})$

‘But why would the above not work?’ Because, of course, transformers are typically trained to predict the next token in a sequence, not to differentiate pieces of text according to their semantics.

The solution to this problem is not to eschew transformer embeddings, but rather to fine-tune them for search. The idea is to encourage the transformer to give us embeddings that place semantically dissimilar items far apart. E.g. let $q=$’busy place’, then we want $ d^+=$’tokyo’ to be close to $q$ and $d^-=$’a small village’ to be far away.

This semantic separation can be achieved by fine-tuning with a contrastive loss [1,2,3,10],

$$
\text{maximize}_{\theta}\,\mathcal{L} = \log \frac{\exp(\text{score}(q, d^+))}{\exp(\text{score}(q, d^+)) + \exp(\text{score}(q, d^-))},
$$

where $\theta$ represents the transformer parameters. The $\exp$’s in the contastive loss are to ensure we never divide by zero. Note that we can interpret the contrastive loss as doing classification since we can think of the argument to the logarithm as $p(d^+ | q)$.

That’s all we need, in principle, to turn a transformer encoder into a text embedder! In practice, the contrastive loss can be generalized to include more positive and negative examples, and it is indeed a good idea to have a large batch size [11] (intuitively it makes the separation of positive and negative examples more difficult, resulting in a better classifier). We also need a fine-tuning dataset – a dataset of positive/negative examples. OpenAI showed that it is possible to construct one in an unsupervised fashion [1]. However, there are also publicly available datasets for supervised fine-tuning, e.g. MSMARCO [12].

Extensions

One really interesting avenue of research is training of general purposes encoders. The idea is to provide instructions alongside the queries/documents [2,3]. The instruction could be $\verb|Embed this document for search: {document}|$ (for the application we’ve been discussing), or $\verb|Embed this document for clustering: {document}|$ to get embeddings suitable for clustering, or $\verb|Embed this document for sentiment analysis: {document}|$ for embeddings suitable for sentiment analysis. The system is fine-tuned end-to-end with the appropriate task, e.g. a contrastive learning objective for the search instruction, a classification objective for sentiment analysis, etc., leaving us with an easy way to generate embeddings for different tasks.

A note on scaling

The real power of semantic (and keyword) search comes when a search corpus is too large for a human to search manually. However if the corpus is enormous, we’d rather avoid looking at every document each time we get a query. Thankfully, there are methods to avoid this by using specially tailored data structures: see Inverted Indices for keyword algorithms, and Hierarchical Navigable Small World graphs [5] for semantic algorithms. These both reduce search time complexity from $\mathcal{O}(|\mathcal{D}|)$ to $\mathcal{O}(\log |\mathcal{D}|)$, where $|\mathcal{D}|$ is the corpus size.

There are many startups (Pinecone, Weviate, Milvus, Chroma, etc.) that are proposing so-called vector databases – databases in which embeddings are stored, and queries can be efficiently performed. Though, there is also work contesting the need for these types of database in the first place [7].

Summary

We summarised search, semantic search, and how transformers are fine-tuned for search with a contrastive loss. I personally find this a very nice area of research with exciting real-world applications – please reach out (ben.anson@bristol.ac.uk) if you’d like to discuss it!

References

[1]: Text and code embeddings by contrastive pre-training, Neelakantan et al (2022)

[2]: Task-aware Retrieval with Instructions, Asai et al (2022)

[3]: One embedder, any task: Instruction-finetuned text embeddings, Su et al (2022)

[4]: Some simple effective approximations to the 2-poisson model for probabilistic weighted retrieval, Robertson and Walker (1994)

[5]: Efficient and robust approximate nearest neighbor search using Hierarchical Navigable Small World graphs, https://arxiv.org/abs/1603.09320

[6]: An Image is Worth 16×16 Words: Transformers for Image Recognition at Scale, https://arxiv.org/abs/2010.11929

[7]: Vector Search with OpenAI Embeddings: Lucene Is All You Need, arXiv preprint arXiv:2308.14963

[8]: Complement lexical retrieval model with semantic residual embeddings, Advances in Information Retrieval (2021)

[9]: Attention is all you need, Advances in neural information processing systems (2017)

[10]: Sgpt: Gpt sentence embeddings for semantic search, arXiv preprint arXiv:2202.08904

[11]: Contrastive representation learning: A framework and review, IEEE Access 8 (2020)

[12]: Ms marco: A human generated machine reading comprehension dataset, arXiv preprint arXiv:1611.09268

[13]: AdANNS: A Framework for Adaptive Semantic Search, arXiv preprint arXiv:2305.19435

Student Perspectives: Machine Learning Models for Probability Distributions

A post by Tennessee Hickling, PhD student on the Compass programme.


Introduction
Probabilistic modelling provides a consistent way to deal with uncertainty in data. The central tool in this methodology is the probability distribution, which describes the randomness of observations. To create effective models of reality, we need to be able to specify probability distributions that are flexible enough to capture real phenomena whilst remaining feasible to estimate. In the past decade machine learning (ML) has developed many new and exciting ways to represent and learn potentially complex probability distributions.

ML has provided significant advances in modelling of high dimensional and highly structured data such as images or text. Many of these modern approaches are applied as “generative models”. The goal of such approaches is to sample new synthetic observations from an approximate distribution which closely matches the target distribution. For example, we may use many images of cats to learn an approximate distribution, from which we can sample new images of cats that appear realistic. Usually, a “generative model” indicates the requirement to sample from the model, but not necessarily assign probabilities to observed data. In this case, the model captures uncertainty by imitating the structure and randomness of the data.

Many of these modern methods work by transforming simple randomness (such as a Normal distribution) into the target complex randomness. In my own research, I work on a known limitation of such approaches to replicate a particular aspect of randomness – the tails of probability distributions [1, 11]. In this post, I wanted to take a step back and provide an overview of and connections between two ML methods that can be used to model probability distributions – Normalising Flows (NFs) and Variational Autoencoders (VAEs).

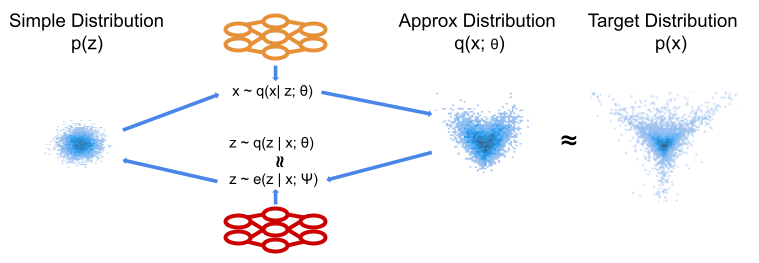
Figure 1: Basic illustration of ML learning of a distribution. We optimise the machine learning model to produce a distribution close to our target. This is often conceptualised in the generative direction, such that our ML model moves samples from the simple distribution to more closely match the target observations.

Some Background
Consider real valued vectors $z \in \mathbb{R}^{d_z}$ and $x \in \mathbb{R}^{d_x}$. In this post I mirror notation used in [2], where $p(x)$ refers to the density and distribution of $x$ and $x \sim p(x)$ indicates samples according to that distribution. The generic set up I am considering is that of density estimation – trying to model the distribution $p(x)$ of some observed data $\{x_i\}_{i=1}^{N}$. I use a semicolon to denote parameters, so $p(x; \beta)$ is a distribution over $x$ with parameters $\beta$. I also make use of different letters to distinguish different distributions, for example using $q(x)$ to denote an approximation to $p(x)$. The notation $\mathbb{E}_p[f(x)]$ refers to the standard expectation of $f(x)$ over the distribution $p$.

The discussed methods introduce some simple source of randomness arising from a known, simple latent distribution $p(z)$. This is also referred to in some literature as the prior, though the usage is not straightforwardly relatable to traditional Bayesian concepts. The goal is then to fit an approximate $q(x|z; \theta)$, that is a conditional distribution, such that $$q(x; \theta) = \int q(x|z; \theta)p(z)dz \approx p(x),$$in words, the marginal density over $x$ implied by the conditional density, is close to our target distribution $p(x)$. In general, we can’t compute $q(x)$, as we can’t solve the above integral for very flexible $q(x | z; \theta)$.

Variational Inference
We commonly make use of the Kullback-Leibler (KL) divergence, which can be interpreted as measuring the difference between two probability distributions. It is a useful practical tool, since we can compute and optimise the quantity in a wide variety of situations. Techniques which optimise a probability distribution using such divergences are known as variational methods. There are other choices of divergence, but KL is the most standard. Important properties of KL are that the quantity $KL(p|| q)$ is non-negative and non-symmetric i.e. $KL(p|| q) \neq KL(q || p)$.

Given this, we can see that a natural objective is to minimise the difference between distributions, as measured by the KL, $$KL(p(x) || q(x; \theta)) = \int p(x) \log \frac{p(x)}{q(x; \theta)} dx.$$Advances in this area have mostly developed new ways to make this optimisation tractable for flexible $q(x | z; \theta)$.

Normalising Flow
A normalising flow is a parameterised transformation of a random variable. The key simplifying assumption is that the forward generation is deterministic. That is, for $d_x = d_z$, that $$
x = T(z; \theta),$$for some transformation function $T$. We additionally require that $T$ is a differentiable bijection. Given these requirements, we can express the approximate density of $x$ exactly as $$q_x(x; \theta) = p_z(T^{-1}(x; \theta))\big|\text{det } J_{T^{-1}}(x; \theta)\big|.$$Here, $\text{det }J_{T^{-1}}$ is the determinant of the Jacobian of the inverse transformation. Research on NFs has developed numerous ways to make the computation of the Jacobian term tractable. The standard approach is to use neural networks to produce $\theta$ (the parameters of the transformation), with numerous ways of configuring the model to capture dependency between dimensions. Additionally, we often stack many layers to provide more flexibility. See [10] and the review [2] for more details on how this is achieved.

As we have access to an analytic approximate density, we can minimise the negative log-likelihood of our model, $$\mathcal{J}(\theta) = -\sum_{i=1}^{N} \log q(x_i; \theta),$$which is the Monte-Carlo approximation of the KL loss (up to an additive constant). This is straightforward to optimise using stochastic gradient descent [9] and automatic differentiation.

Figure 2: Schematic of NF model. The ML model produces the parameters of our transformation, which are identical in the forward and backwards directions. We choose the transformation such that we can express an analytic density function for our approximate distribution.

Variational Autoencoder
In the Variational Autoencoder (VAE) [3] the conditional distribution $q(x| z; \theta)$ is known as the decoder. VAEs consider the marginal in terms of the posterior, that is $$q(x; \theta) = \frac{q(x | z; \theta)p(z)}{q(z | x; \theta)}.$$The posterior $q(z | x; \theta)$ is itself not generally tractable. VAEs proceed by introducing an encoder, which approximates $q(z | x; \theta)$. This is itself simply a conditional distribution $e(z | x; \psi)$. We use this approximation to express the log marginal over $x$ as below.
$$\begin{align}
\log q(x; \theta) &= \mathbb{E}_{e}\bigg[\log q(x; \theta)\frac{e(z | x; \psi)}{e(z | x; \psi)}\bigg] \\
&= \mathbb{E}_{e}\bigg[\log\frac{q(x | z; \theta)p(z)}{q(z | x; \theta)}\frac{e(z | x; \psi)}{e(z | x; \psi)}\bigg] \\
&= \mathbb{E}_{e}\bigg[\log\frac{q(x | z; \theta)p(z)}{e(z | x; \psi)}\bigg] + KL(e(z | x; \psi) || q(z | x; \theta)) \\
&= \mathcal{J}_{\theta,\psi} + KL(e(z | x; \psi) || q(z | x; \theta))
\end{align}$$
The additional approximation gives a more complex expression and does not provide an analytical approximate density. However, as $KL(e(z | x; \psi) || q(z | x; \theta))$ is positive, $\mathcal{J}_{\theta,\psi}$ forms a lower bound on $\log q(x; \theta)$. This expression is commonly referred to as the Evidence Lower Bound (or ELBO). The second term, the divergence between our encoder and the implied posterior will be minimised as we increase $\mathcal{J}_{\theta,\psi}$ in $\psi$. As we increase $\mathcal{J}_{\theta,\psi}$, we will either be increasing $\log q(x; \theta)$ or reducing $KL(e(z | x; \psi) || q(z | x; \theta))$.

The goal is to increase $\log q(x; \theta)$, which we hope occurs as we optimise over both parameters. This ambiguity in optimisation results in well known issues, such as posterior collapse [12] and can result in some counter-intuitive behaviour [4]. Despite this, VAEs remain a powerful and popular approach. An important benefit is that we no longer require $d_x = d_z$, which means we can map high dimensional $x$ to low dimensional $z$ to perform dimensionality reduction.

Figure 3: Schematic of VAE model. We now have a stochastic forward transformation. To optimise this we introduce a decoder model which approximates the posterior implied by the forward transformation. We now have a more flexible transformation, but two models to train and no analytic approximate density.

Surjective Flows
We can now identify a connection between NFs and VAEs. Recent work has reinterpreted NFs within the VAE framework, permitting a broader class of transitions whilst retaining analytic tractability of NFs [5]. Considering our decoding conditional as $$q(x|z; \theta) = \delta(x – T(z; \theta)),$$ we have the posterior exactly as
$$q(z|x; \theta) = \delta(z – T^{-1}(x; \theta)),$$
where $\delta$ is the dirac delta function.

This provides a view of a NF as a special case of a VAE, where we don’t need to approximate the posterior. Considering our VAE approximation, $$
\log q(x; \theta) = \mathbb{E}_e\big[\log p(z) + \log\frac{q(x | z; \theta)}{e(z | x; \psi)}\big] + KL(e(z | x; \psi) || q(z | x; \theta)),
$$and taking $e(z | x; \psi) = q(z | x; \theta)$, then the final KL term is 0 by definition. In that case, we recover our analytic density for NFs (see [5] for details).

Note that accessing an analytic density depends on having $e(z | x; \psi) = q(z | x; \theta)$ and computing $$\mathbb{E}_e\big[\log p(z) + \log\frac{q(x | z; \theta)}{e(z | x; \psi)}\big].$$These requirements are actually weaker than those we apply in the case of standard NFs. Consider a deterministic transformation $T^{-1}(x)$ which is surjective, crucially we can have many $x$ which map to the same $z$, so no longer have an analytic inverse. However we can still choose a $q(x | z)$ which is stochastic inverse of $T^{-1}$. For example, consider an absolute value surjection, $q(z | x) = \delta(z – |x|)$, to invert this transformation we can choose $q(x | z) = \frac{1}{2}\delta(x – z) + \frac{1}{2}\delta(x + z)$, which we can sample from straight-forwardly. This transformation enforces symmetry across the origin in the approximate distribution, a potentially useful inductive bias. In this example, and many others, we can also compute the density exactly. This has led to a number of interesting extensions to NFs, such as “funnel flows” which have $d_z < d_x$ but retain an analytic approximate density [6]. As we retain an analytic approximate density, we can optimise them in the same way as NFs.

Figure 4: Schematic of a surjective transformation. We have a stochastic forward transformation, but the inverse is deterministic. This restricts what transformations we can have, but retains an analytic approximate density.

Conclusion
I have presented an overview of two widely-used methods for modelling probability distributions with machine learning techniques. I’ve also highlighted an interesting connection between these methods, an area of research that has led to the development of interesting new models. It’s worth noting that other important classes of ML models such as Generative Adversarial Networks and Diffusion models can also be interpreted as approximate probability distributions. There are many superficial connections between those methods and the ones discussed here. Exploring these theoretical similarities presents an compelling direction of research to sharpen understanding of such models’ relative advantages. Another promising direction is the synthesis of these methods, where researchers aim to harness the strengths of each approach [7,8]. This not only enhances the existing knowledge base but also offers opportunities for innovative applications in the field.

References
[1] Jaini, Priyank, et al. “Tails of Lipschitz triangular flows.” International Conference on Machine Learning. PMLR, 2020
[2] Papamakarios, G., et al. “Normalizing flows for probabilistic modeling and inference.” Journal of Machine Learning Research, 2021
[3] Kingma, Diederik P., and Max Welling. “Auto-encoding variational bayes.” arXiv:1312.6114, 2013
[4] Rainforth, Tom, et al. “Tighter variational bounds are not necessarily better.” International Conference on Machine Learning. PMLR, 2018
[5] Nielsen, Didrik, et al. “Survae flows: Surjections to bridge the gap between vaes and flows.” Advances in Neural Information Processing, 2020
[6] Samuel Klein, et al. “Funnels: Exact maximum likelihood with dimensionality reduction.” arXiv:2112.08069, 2021
[7] Kingma, Durk P., et al. “Improved variational inference with inverse autoregressive flow.” Advances in neural information processing systems , 2016
[8] Zhang, Qinsheng, and Yongxin Chen. “Diffusion normalizing flow.” Advances in Neural Information Processing Systems 34, 2021
[9] Ettore Fincato “An Introduction to Stochastic Gradient Methods” https://compass.blogs.bristol.ac.uk/2023/03/14/stochastic-gradient-methods/
[10] Daniel Ward “An introduction to normalising flows” https://compass.blogs.bristol.ac.uk/2022/07/13/2608/
[11] Tennessee Hickling and Dennis Prangle, “Flexible Tails for Normalising Flows, with Application to the Modelling of Financial Return Data”, 8th MIDAS Workshop, ECML PKDD, 2023
[12] Lucas, James, et al. “Don’t blame the elbo! a linear vae perspective on posterior collapse.” Advances in Neural Information Processing Systems 32, 2019

Summer applications deadline for Compass CDT: 12 June 2023

We are happy to announce our upcoming applications deadline is 12 June 2023, 23:59 (London UK time zone) for the final few fully funded places to start September 2023. For international applications there are limited scholarship funded places available. Early applications advised.

Compass is offering specific projects for PhD students to study from Sept 2023. We are pleased to announce that there are 4 new project opportunities to study. The full list of the projects/ supervisors has been updated. All the supervisors listed are open to discussion on the projects provided and can also talk to applicants about other project ideas. Please provide a ranked list of 3 projects of interest: 1 = project of highest interest. Project supervisors will be happy to respond to specific questions you have after reading the proposals. Applicants should contact them by email if they wish beforehand.

New PhD Projects available

The full list of the projects/ supervisors.

PhD Project Allocation Process

Application forms will be reviewed based on the 3 ranked projects specified or other proposed topic. Successful applicants will be invited to attend an interview with the Compass admissions tutors and the specific project supervisor. If you are made an offer of PhD study it will be published through the online application system. You will then have 2 weeks to consider the offer before deciding whether to accept or decline.

We welcome applications from all members of our community and are particularly encouraging those from diverse groups, such as members of the LGBT+ and black, Asian and minority ethnic communities, to join us.

APPLICATIONS DEADLINE

12 June 2023, 23:59 (London UK time zone)

APPLY NOW

Advantages of being a Compass Student

  • Stipend – a generous stipend of £22,622 pa tax free, paid in monthly payments. Plus your own expense budget of £1,000 pa towards travel and research activity.
  • No fees – all tuition fees are covered by the EPSRC and University of Bristol.
  • Bespoke training – first year units are designed specifically for the academic needs of each Compass student, which enables students to develop knowledge and capability to pursue cross-disciplinary PhD research.
  • Supervisors – supervisors from across academic disciplines offer a range of research projects.
  • Cohort – Compass students benefit from dedicated offices and collaboration spaces, enabling strong cohort links and opportunities for shared learning and research.

About Compass CDT

A 4-year bespoke PhD training programme in the statistical and computational techniques of data science, with partners from across the University of Bristol, industry and government agencies.

The cross-disciplinary programme offers exciting collaborations across medicine, computer science, geography, economics, life and earth sciences, as well as with our external partners who range from government organisations such as the Office for National Statistics, NCSC and the AWE, to industrial partners such as LV, Improbable, IBM Research, EDF, and AstraZeneca.

Students are co-located with the Institute for Statistical Science in the School of Mathematics, which occupies the Fry Building.

Hear from our students about their experience with the programme

  • Compass has allowed me to advance my statistical knowledge and apply it to a range of exciting applied projects, as well as develop skills that I’m confident will be highly useful for a future career in data science. – Shannon, Cohort 2

  • With the Compass CDT I feel part of a friendly, interactive environment that is preparing me for whatever I move on to next, whether it be in Academia or Industry. – Sam, Cohort 2

  • An incredible opportunity to learn the ever-expanding field of data science, statistics and machine learning amongst amazing people. – Danny, Cohort 1

Compass CDT Video

Find out more about what it means to be a part of the Compass programme from our students in this short video.

APPLICATIONS DEADLINE

12 June 2023, 23:59 (London UK time zone)

APPLY NOW

Compass CDT is recruiting for its final few fully funded places to start September 2023

We are happy to announce our upcoming applications deadline of 16 March 2023 for Compass CDT programme. For international applications there are limited scholarship funded places available for this final recruitment round. Early applications advised.

Compass is offering specific projects for PhD students to study from Sept 2023. The projects are listed in the research section of our website. All the supervisors listed are open to discussion on the projects provided and can also talk to applicants about other project ideas. Please provide a ranked list of 3 projects of interest: 1 = project of highest interest. Project supervisors will be happy to respond to specific questions you have after reading the proposals. Applicants should contact them by email if they wish beforehand.

Also, we are pleased to announce a new project Genetic Similarity Based Cohort Building that has been added to the list for September 2023 start funded by Roche, one of the world’s largest biotech companies, as well as a leading provider of in-vitro diagnostics and a global supplier of transformative innovative solutions across major disease areas.

PhD Project Allocation Process

Application forms will be reviewed based on the 3 ranked projects specified or other proposed topic. Successful applicants will be invited to attend an interview with the Compass admissions tutors and the specific project supervisor. If you are made an offer of PhD study it will be published through the online application system. You will then have 2 weeks to consider the offer before deciding whether to accept or decline.

We welcome applications from all members of our community and are particularly encouraging those from diverse groups, such as members of the LGBT+ and black, Asian and minority ethnic communities, to join us.

APPLICATIONS DEADLINE

16 March 2023, 23:59 (London UK time zone)

APPLY NOW

Advantages of being a Compass Student

  • Stipend – a generous stipend of £21,668 pa tax free, paid in monthly payments. Plus your own expense budget of £1,000 pa towards travel and research activity.
  • No fees – all tuition fees are covered by the EPSRC and University of Bristol.
  • Bespoke training – first year units are designed specifically for the academic needs of each Compass student, which enables students to develop knowledge and capability to pursue cross-disciplinary PhD research.
  • Supervisors – supervisors from across academic disciplines offer a range of research projects.
  • Cohort – Compass students benefit from dedicated offices and collaboration spaces, enabling strong cohort links and opportunities for shared learning and research.

About Compass CDT

A 4-year bespoke PhD training programme in the statistical and computational techniques of data science, with partners from across the University of Bristol, industry and government agencies.

The cross-disciplinary programme offers exciting collaborations across medicine, computer science, geography, economics, life and earth sciences, as well as with our external partners who range from government organisations such as the Office for National Statistics, NCSC and the AWE, to industrial partners such as LV, Improbable, IBM Research, EDF, and AstraZeneca.

Students are co-located with the Institute for Statistical Science in the School of Mathematics, which occupies the Fry Building.

Hear from our students about their experience with the programme

  • Compass has allowed me to advance my statistical knowledge and apply it to a range of exciting applied projects, as well as develop skills that I’m confident will be highly useful for a future career in data science. – Shannon, Cohort 2

  • With the Compass CDT I feel part of a friendly, interactive environment that is preparing me for whatever I move on to next, whether it be in Academia or Industry. – Sam, Cohort 2

  • An incredible opportunity to learn the ever-expanding field of data science, statistics and machine learning amongst amazing people. – Danny, Cohort 1

Compass CDT Video

Find out more about what it means to be a part of the Compass programme from our students in this short video.

APPLICATIONS DEADLINE

16 March 2023, 23:59 (London UK time zone)

APPLY NOW

Applications now open for PhD in Computational Statistics and Data Science

Start your PhD in Data Science now

Compass CDT is now recruiting for its fully funded places to start September 2023.

We are happy to announce that The University of Bristol online application system is open, and we are receiving applications for Compass CDT programme for September 2023 start. Early application is advised.

For 2023/34 entry, applicants must review the projects on offer. The projects are listed in the research section of our website. You will need to provide a Research Statement in your application documents with a ranked list of 3 projects of interest to you: 1 being the project of highest interest.

PhD Project Allocation Process

Application forms will be reviewed based on the 3 ranked projects specified. Successful applicants will be invited to attend an interview with the Compass admissions tutors and the specific project supervisor. If you are made an offer of PhD study it will be published through the online application system. You will then have 2 weeks to consider the offer before deciding whether to accept or decline.

The next review of applications for 2023 funded places will take place after

4 January 2023.

APPLY NOW

We welcome applications from all members of our community and are particularly encouraging those from diverse groups, such as members of the LGBT+ and black, Asian and minority ethnic communities, to join us.

Advantages of being a Compass Student

  • Stipend – a generous stipend of £21,668 pa tax free, paid in monthly payments. Plus your own expense budget of £1,000 pa towards travel and research activity.
  • No fees – all tuition fees are covered by the EPSRC and University of Bristol.
  • Bespoke training – first year units are designed specifically for the academic needs of each Compass student, which enables students to develop knowledge and capability to pursue cross-disciplinary PhD research.
  • Supervisors – supervisors from across academic disciplines offer a range of research projects.
  • Cohort – Compass students benefit from dedicated offices and collaboration spaces, enabling strong cohort links and opportunities for shared learning and research.

About Compass CDT

A 4-year bespoke PhD training programme in the statistical and computational techniques of data science, with partners from across the University of Bristol, industry and government agencies.

The cross-disciplinary programme offers exciting collaborations across medicine, computer science, geography, economics, life and earth sciences, as well as with our external partners who range from government organisations such as the Office for National Statistics, NCSC and the AWE, to industrial partners such as LV, Improbable, IBM Research, EDF, and AstraZeneca.

Students are co-located with the Institute for Statistical Science in the School of Mathematics, which occupies the Fry Building.

Hear from our students about their experience with the programme

  • Compass has allowed me to advance my statistical knowledge and apply it to a range of exciting applied projects, as well as develop skills that I’m confident will be highly useful for a future career in data science. – Shannon, Cohort 2

  • With the Compass CDT I feel part of a friendly, interactive environment that is preparing me for whatever I move on to next, whether it be in Academia or Industry. – Sam, Cohort 2

  • An incredible opportunity to learn the ever-expanding field of data science, statistics and machine learning amongst amazing people. – Danny, Cohort 1

APPLY BEFORE: 

Wednesday 4 January 2023, 5pm (London, UK time zone)

APPLY NOW

Skip to toolbar