Student Perspectives: SPREE Methods for Small Area Estimation

A post by Codie Wood, PhD student on the Compass programme.

This blog post is an introduction to structure preserving estimation (SPREE) methods. These methods form the foundation of my current work with the Office for National Statistics (ONS), where I am undertaking a six-month internship as part of my PhD. During this internship, I am focusing on the use of SPREE to provide small area estimates of population characteristic counts and proportions.

Small area estimation

Small area estimation (SAE) refers to the collection of methods used to produce accurate and precise population characteristic estimates for small population domains. Examples of domains may include low-level geographical areas, or population subgroups. An example of an SAE problem would be estimating the national population breakdown in small geographical areas by ethnic group [2015_Luna].

Demographic surveys with a large enough scale to provide high-quality direct estimates at a fine-grain level are often expensive to conduct, and so smaller sample surveys are often conducted instead.

SAE methods work by drawing information from different data sources and similar population domains in order to obtain accurate and precise model-based estimates where sample counts are too small for high quality direct estimates. We use the term small area to refer to domains where we have little or no data available in our sample survey.

SAE methods are frequently relied upon for population characteristic estimation, particularly as there is an increasing demand for information about local populations in order to ensure correct allocation of resources and services across the nation.

Structure preserving estimation

Structure preserving estimation (SPREE) is one of the tools used within SAE to provide population composition estimates. We use the term composition here to refer to a population break down into a two-way contingency table containing positive count values. Here, we focus on the case where we have a population broken down into geographical areas (e.g. local authority) and some subgroup or category (e.g. ethnic group or age).

Orginal SPREE-type estimators, as proposed in [1980_Purcell], can be used in the case when we have a proxy data source for our target composition, containing information for the same set of areas and categories but that may not entirely accurately represent the variable of interest. This is usually because the data are outdated or have a slightly different variable definition than the target.

We also incorporate benchmark estimates of the row and column totals for our composition of interest, taken from trusted, quality assured data sources and treated as known values. This ensures consistency with higher level known population estimates. SPREE then adjusts the proxy data to the estimates of the row and column totals to obtain the improved estimate of the target composition.

IMG_1633

An illustration of the data required to produce SPREE-type estimates.

In an extension of SPREE, known as generalised SPREE (GSPREE) [2004_Zhang], the proxy data can also be supplemented by sample survey data to generate estimates that are less subject to bias and uncertainty than it would be possible to generate from each source individually. The survey data used is assumed to be a valid measure of the target variable (i.e. it has the same definition and is not out of date), but due to small sample sizes may have a degree of uncertainty or bias for some cells.

The GSPREE method establishes a relationship between the proxy data and the survey data, with this relationship being used to adjust the proxy compositions towards the survey data.

IMG_1634 (1)

An illustration of the data required to produce GSPREE estimates.

GSPREE is not the only extension to SPREE-type methods, but those are beyond the scope of this post. Further extensions such as Multivariate SPREE are discussed in detail in [2016_Luna].

Original SPREE methods

First, we describe original SPREE-type estimators. For these estimators, we require only well-established estimates of the margins of our target composition.

We will denote the target composition of interest by $\mathbf{Y} = (Y{aj})$, where $Y{aj}$ is the cell count for small area $a = 1,\dots,A$ and group $j = 1,\dots,J$. We can write $\mathbf Y$ in the form of a saturated log-linear model as the sum of four terms,

$$ \log Y_{aj} = \alpha_0^Y + \alpha_a^Y + \alpha_j^Y + \alpha_{aj}^Y.$$

There are multiple ways to write this parameterisation, and here we use the centered constraints parameterisation given by $$\alpha_0^Y = \frac{1}{AJ}\sum_a\sum_j\log Y_{aj},$$ $$\alpha_a^Y = \frac{1}{J}\sum_j\log Y_{aj} – \alpha_0^Y,$$ $$\alpha_j^Y = \frac{1}{A}\sum_a\log Y_{aj} – \alpha_0^Y,$$ $$\alpha_{aj}^Y = \log Y_{aj} – \alpha_0^Y – \alpha_a^Y – \alpha_j^Y,$$

which satisfy the constraints $\sum_a \alpha_a^Y = \sum_j \alpha_j^Y = \sum_a \alpha_{aj}^Y = \sum_j \alpha_{aj}^Y = 0.$

Using this expression, we can decompose $\mathbf Y$ into two structures:

  1. The association structure, consisting of the set of $AJ$ interaction terms $\alpha_{aj}^Y$ for $a = 1,\dots,A$ and $j = 1,\dots,J$. This determines the relationship between the rows (areas) and columns (groups).
  2. The allocation structure, consisting of the sets of terms $\alpha_0^Y, \alpha_a^Y,$ and $\alpha_j^Y$ for $a = 1,\dots,A$ and $j = 1,\dots,J$. This determines the size of the composition, and differences between the sets of rows (areas) and columns (groups).

Suppose we have a proxy composition $\mathbf X$ of the same dimensions as $\mathbf Y$, and we have the sets of row and column margins of $\mathbf Y$ denoted by $\mathbf Y_{a+} = (Y_{1+}, \dots, Y_{A+})$ and $\mathbf Y_{+j} = (Y_{+1}, \dots, Y_{+J})$, where $+$ substitutes the index being summed over.

We can then use iterative proportional fitting (IPF) to produce an estimate $\widehat{\mathbf Y}$ of $\mathbf Y$ that preserves the association structure observed in the proxy composition $\mathbf X$. The IPF procedure is as follows:

  1. Rescale the rows of $\mathbf X$ as $$ \widehat{Y}_{aj}^{(1)} = X_{aj} \frac{Y_{+j}}{X_{+j}},$$
  2. Rescale the columns of $\widehat{\mathbf Y}^{(1)}$ as $$ \widehat{Y}_{aj}^{(2)} = \widehat{Y}_{aj}^{(1)} \frac{Y_{a+}}{\widehat{Y}_{a+}^{(1)}},$$
  3. Rescale the rows of $\widehat{\mathbf Y}^{(2)}$ as $$ \widehat{Y}_{aj}^{(3)} = \widehat{Y}_{aj}^{(2)} \frac{Y_{+j}}{\widehat{Y}_{+j}^{(2)}}.$$

Steps 2 and 3 are then repeated until convergence occurs, and we have a final composition estimate denoted by $\widehat{\mathbf Y}^S$ which has the same association structure as our proxy composition, i.e. we have $\alpha_{aj}^X = \alpha_{aj}^Y$ for all $a \in \{1,\dots,A\}$ and $j \in \{1,\dots,J\}.$ This is a key assumption of the SPREE implementation, which in practise is often restrictive, motivating a generalisation of the method.

Generalised SPREE methods

If we can no longer assume that the proxy composition and target compositions have the same association structure, we instead use the GSPREE method first introduced in [2004_Zhang], and incorporate survey data into our estimation process.

The GSPREE method relaxes the assumption that $\alpha_{aj}^X = \alpha_{aj}^Y$ for all $a \in \{1,\dots,A\}$ and $j \in \{1,\dots,J\},$ instead imposing the structural assumption $\alpha_{aj}^Y = \beta \alpha_{aj}^X$, i.e. the association structure of the proxy and target compositions are proportional to one another. As such, we note that SPREE is a particular case of GSPREE where $\beta = 1$.

Continuing with our notation from the previous section, we proceed to estimate $\beta$ by modelling the relationship between our target and proxy compositions as a generalised linear structural model (GLSM) given by
$$\tau_{aj}^Y = \lambda_j + \beta \tau_{aj}^X,$$ with $\sum_j \lambda_j = 0$, and where $$ \begin{align} \tau_{aj}^Y &= \log Y_{aj} – \frac{1}{J}\sum_j\log Y_{aj},\\
&= \alpha_{aj}^Y + \alpha_j^Y,
\end{align}$$ and analogously for $\mathbf X$.

It is shown in [2016_Luna] that fitting this model is equivalent to fitting a Poisson generalised linear model to our cell counts, with a $\log$ link function. We use the association structure of our proxy data, as well as categorical variables representing the area and group of the cell, as our covariates. Then we have a model given by $$\log Y_{aj} = \gamma_a + \tilde{\lambda}_j + \tilde{\beta}\alpha_{aj}^X,$$ with $\gamma_a = \alpha_0^Y + \alpha_a^Y$, $\tilde\lambda_j = \alpha_j^Y$ and $\tilde\beta \alpha_{aj}^X = \alpha_{aj}^Y.$

When fitting the model we use survey data $\tilde{\mathbf Y}$ as our response variable, and are then able to obtain a set of unbenchmarked estimates of our target composition. The GSPREE method then benchmarks these to estimates of the row and column totals, following a procedure analagous to that undertaken in the orginal SPREE methodology, to provide a final set of estimates for our target composition.

ONS applications

The ONS has used GSPREE to provide population ethnicity composition estimates in intercensal years, where the detailed population estimates resulting from the census are outdated [2015_Luna]. In this case, the census data is considered the proxy data source. More recent works have also used GSPREE to estimate counts of households and dwellings in each tenure at the subnational level during intercensal years [2023_ONS].

My work with the ONS has focussed on extending the current workflows and systems in place to implement these methods in a reproducible manner, allowing them to be applied to a wider variety of scenarios with differing data availability.

References

[1980_Purcell] Purcell, Noel J., and Leslie Kish. 1980. ‘Postcensal Estimates for Local Areas (Or Domains)’. International Statistical Review / Revue Internationale de Statistique 48 (1): 3–18. https://doi.org/10/b96g3g.

[2004_Zhang] Zhang, Li-Chun, and Raymond L. Chambers. 2004. ‘Small Area Estimates for Cross-Classifications’. Journal of the Royal Statistical Society Series B: Statistical Methodology 66 (2): 479–96. https://doi.org/10/fq2ftt.

[2015_Luna] Luna Hernández, Ángela, Li-Chun Zhang, Alison Whitworth, and Kirsten Piller. 2015. ‘Small Area Estimates of the Population Distribution by Ethnic Group in England: A Proposal Using Structure Preserving Estimators’. Statistics in Transition New Series and Survey Methodology 16 (December). https://doi.org/10/gs49kq.

[2016_Luna] Luna Hernández, Ángela. 2016. ‘Multivariate Structure Preserving Estimation for Population Compositions’. PhD thesis, University of Southampton, School of Social Sciences. https://eprints.soton.ac.uk/404689/.

[2023_ONS] Office for National Statistics (ONS), released 17 May 2023, ONS website, article, Tenure estimates for households and dwellings, England: GSPREE compared with Census 2021 data

Student Perspectives: Impurity Identification in Oligonucleotide Drug Samples

A post by Harry Tata, PhD student on the Compass programme.

Oligonucleotides in Medicine

Oligonucleotide therapies are at the forefront of modern pharmaceutical research and development, with recent years seeing major advances in treatments for a variety of conditions. Oligonucleotide drugs for Duchenne muscular dystrophy (FDA approved) [1], Huntington’s disease (Phase 3 clinical trials) [2], and Alzheimer’s disease [3] and amyotrophic lateral sclerosis (early-phase clinical trials) [4] show their potential for tackling debilitating and otherwise hard-to-treat conditions. With continuing development of synthetic oligonucleotides, analytical techniques such as mass spectrometry must be tailored to these molecules and keep pace with the field.

Working in conjunction with AstraZeneca, this project aims to advance methods for impurity detection and quantification in synthetic oligonucleotide mass spectra. In this blog post we apply a regularised version of the Richardson-Lucy algorithm, an established technique for image deconvolution, to oligonucleotide mass spectrometry data. This allows us to attribute signals in the data to specific molecular fragments, and therefore to detect impurities in oligonucleotide synthesis.

Oligonucleotide Fragmentation

If we have attempted to synthesise an oligonucleotide \mathcal O with a particular sequence, we can take a sample from this synthesis and analyse it via mass spectrometry. In this process, molecules in the sample are first fragmented — broken apart into ions — and these charged fragments are then passed through an electromagnetic field. The trajectory of each fragment through this field depends on its mass/charge ratio (m/z), so measuring these trajectories (e.g. by measuring time of flight before hitting some detector) allows us to calculate the m/z of fragments in the sample. This gives us a discrete mass spectrum: counts of detected fragments (intensity) across a range of m/z bins [5].

To get an idea of how much of \mathcal O is in a sample, and what impurities might be present, we first need to consider what fragments \mathcal O will produce. Oligonucleotides are short strands of DNA or RNA; polymers with a backbone of sugars (such as ribose in RNA) connected by linkers (e.g. a phosphodiester bond), where each sugar has an attached base which encodes genetic information [6].

On each monomer, there are two sites where fragmentation is likely to occur: at the linker (backbone cleavage) or between the base and sugar (base loss). Specifically, depending on which bond within the linker is broken, there are four modes of backbone cleavage [7,8].
We include in \mathcal F every product of a single fragmentation of \mathcal O — any of the four backbone cleavage modes or base loss anywhere along the nucleotide — as well as the results of every combination of two fragmentations (different cleavage modes at the same linker are mutually exclusive).

Sparse Richardson-Lucy Algorithm

Suppose we have a chemical sample which we have fragmented and analysed by mass spectrometry. This gives us a spectrum across n bins (each bin corresponding to a small m/z range), and we represent this spectrum with the column vector \mathbf{b}\in\mathbb R^n, where b_i is the intensity in the i^{th} bin. For a set \{f_1,\ldots,f_m\}=\mathcal F of possible fragments, let x_j be the amount of f_j that is actually present. We would like to estimate the amounts of each fragment based on the spectrum \mathbf b.

If we had a sample comprising a unit amount of a single fragment f_j, so x_j=1 and x_{k\ne j}=0, and this produced a spectrum \begin{pmatrix}a_{1j}&\ldots&a_{nj}\end{pmatrix}^T, we can say the intensity contributed to bin i by x_j is a_{ij}. In mass spectrometry, the intensity in a single bin due to a single fragment is linear in the amount of that fragment, and the intensities in a single bin due to different fragments are additive, so in some general spectrum we have b_i=\sum_j x_ja_{ij}.

By constructing a library matrix \mathbf{A}\in\mathbb R^{n\times m} such that \{\mathbf A\}_{ij}=a_{ij} (so the columns of \mathbf A correspond to fragments in \mathcal F), then in ideal conditions the vector of fragment amounts \mathbf x=\begin{pmatrix}x_1&\ldots&x_m\end{pmatrix}^T solves \mathbf{Ax}=\mathbf{b}. In practice this exact solution is not found — due to experimental noise and potentially because there are contaminant fragments in the sample not included in \mathcal F — and we instead make an estimate \mathbf {\hat x} for which \mathbf{A\hat x} is close to \mathbf b.

Note that the columns of \mathbf A correspond to fragments in \mathcal F: the values in a single column represent intensities in each bin due to a single fragment only. We \ell_1-normalise these columns, meaning the total intensity (over all bins) of each fragment in the library matrix is uniform, and so the values in \mathbf{\hat x} can be directly interpreted as relative abundances of each fragment.

The observed intensities — as counts of fragments incident on each bin — are realisations of latent Poisson random variables. Assuming these variables are i.i.d., it can be shown that the estimate of \mathbf{x} which maximises the likelihood of the system is approximated by the iterative formula

\mathbf {\hat{x}}^{(t+1)}=\left(\mathbf A^T \frac{\mathbf b}{\mathbf{A\hat x}^{(t)}}\right)\odot \mathbf{\hat x}^{(t)}.

Here, quotients and the operator \odot represent (respectively) elementwise division and multiplication of two vectors. This is known as the Richardson-Lucy algorithm [9].

In practice, when we enumerate oligonucleotide fragments to include in \mathcal F, most of these fragments will not actually be produced when the oligonucleotide passes through a mass spectrometer; there is a large space of possible fragments and (beyond knowing what the general fragmentation sites are) no well-established theory allowing us to predict, for a new oligonucleotide, which fragments will be abundant or negligible. This means we seek a sparse estimate, where most fragment abundances are zero.

The Richardson-Lucy algorithm, as a maximum likelihood estimate for Poisson variables, is analagous to ordinary least squares regression for Gaussian variables. Likewise lasso regression — a regularised least squares regression which favours sparse estimates, interpretable as a maximum a posteriori estimate with Laplace priors — has an analogue in the sparse Richardson-Lucy algorithm:

\mathbf {\hat{x}}^{(t+1)}=\left(\mathbf A^T \frac{\mathbf b}{\mathbf{A\hat x}^{(t)}}\right)\odot \frac{ \mathbf{\hat x}^{(t)}}{\mathbf 1 + \lambda},

where \lambda is a regularisation parameter [10].

Library Generation

For each oligonucleotide fragment f\in\mathcal F, we smooth and bin the m/z values of the most abundant isotopes of f, and store these values in the columns of \mathbf A. However, if these are the only fragments in \mathcal F then impurities will not be identified: the sparse Richardson-Lucy algorithm will try to fit oligonucleotide fragments to every peak in the spectrum, even ones that correspond to fragments not from the target oligonucleotide. Therefore we also include ‘dummy’ fragments corresponding to single peaks in the spectrum — the method will fit these to non-oligonucleotide peaks, showing the locations of any impurities.

Results

For a mass spectrum from a sample containing a synthetic oligonucleotide, we generated a library of oligonucleotide and dummy fragments as described above, and applied the sparse Richardson-Lucy algorithm. Below, the model fit is plotted alongside the (smoothed, binned) spectrum and the ten most abundant fragments as estimated by the model. These fragments are represented as bars with binned m/z at the peak fragment intensity, and are separated into oligonucleotide fragments and dummy fragments indicating possible impurities. All intensities and abundances are Anscombe transformed (x\rightarrow\sqrt{x+3/8}) for clarity.

As the oligonucleotide in question is proprietary, its specific composition and fragmentation is not mentioned here, and the bins plotted have been transformed (without changing the shape of the data) so that individual fragment m/z values are not identifiable.

We see the data is fit extremely closely, and that the spectrum is quite clean: there is one very pronounced peak roughly in the middle of the m/z range. This peak corresponds to one of the oligonucleotide fragments in the library, although there is also an abundant dummy fragment slightly to the left inside the main peak. Fragment intensities in the library matrix are smoothed, and it may be the case that the smoothing here is inappropriate for the observed peak, hence other fragments being fit at the peak edge. Investigating these effects is a target for the rest of the project.

We also see several smaller peaks, most of which are modelled with oligonucleotide fragments. One of these peaks, at approximately bin 5352, has a noticeably worse fit if excluding dummy fragments from the library matrix (see below). Using dummy fragments improves this fit and indicates a possible impurity. Going forward, understanding and quantification of these impurities will be improved by including other common fragments in the library matrix, and by grouping fragments which correspond to the same molecules.

References

[1] Junetsu Igarashi, Yasuharu Niwa, and Daisuke Sugiyama. “Research and Development of Oligonucleotide Therapeutics in Japan for Rare Diseases”. In: Future Rare Diseases 2.1 (Mar. 2022), FRD19.

[2] Karishma Dhuri et al. “Antisense Oligonucleotides: An Emerging Area in Drug Discovery and Development”. In: Journal of Clinical Medicine 9.6 (6 June 2020), p. 2004.

[3] Catherine J. Mummery et al. “Tau-Targeting Antisense Oligonucleotide MAPTRx in Mild Alzheimer’s Disease: A Phase 1b, Randomized, Placebo-Controlled Trial”. In: Nature Medicine (Apr. 24, 2023), pp. 1–11.

[4] Benjamin D. Boros et al. “Antisense Oligonucleotides for the Study and Treatment of ALS”. In: Neurotherapeutics: The Journal of the American Society for Experimental NeuroTherapeutics 19.4 (July 2022), pp. 1145–1158.

[5] Ingvar Eidhammer et al. Computational Methods for Mass Spectrometry Proteomics. John Wiley & Sons, Feb. 28, 2008. 299 pp.

[6] Harri Lönnberg. Chemistry of Nucleic Acids. De Gruyter, Aug. 10, 2020.

[7] S. A. McLuckey, G. J. Van Berkel, and G. L. Glish. “Tandem Mass Spectrometry of Small, Multiply Charged Oligonucleotides”. In: Journal of the American Society for Mass Spectrometry 3.1 (Jan. 1992), pp. 60–70.

[8] Scott A. McLuckey and Sohrab Habibi-Goudarzi. “Decompositions of Multiply Charged Oligonucleotide Anions”. In: Journal of the American Chemical Society 115.25 (Dec. 1, 1993), pp. 12085–12095.

[9] Mario Bertero, Patrizia Boccacci, and Valeria Ruggiero. Inverse Imaging with Poisson Data: From Cells to Galaxies. IOP Publishing, Dec. 1, 2018.

[10] Elad Shaked, Sudipto Dolui, and Oleg V. Michailovich. “Regularized Richardson-Lucy Algorithm for Reconstruction of Poissonian Medical Images”. In: 2011 IEEE International Symposium on Biomedical Imaging: From Nano to Macro. Mar. 2011, pp. 1754–1757.


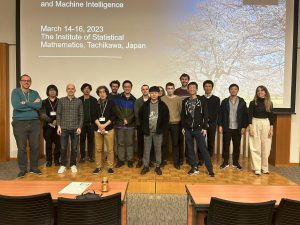
Compass students attending the Workshop on Functional Inference and Machine Intelligence (FIMI) at ISM Tokyo

A post by Compass CDT students Edward Milsom, Jake Spiteri, Jack Simons, and Sam Stockman.

We (Edward Milsom, Jake Spiteri, Jack Simons, Sam Stockman) attended the 2023 Workshop on Functional Inference and Machine Intelligence (FIMI) taking place on the 14, 15 and 16th of March at the Institute of Statistical Mathematics in Tokyo, Japan. Our attendance to the workshop was to further collaborative ties between the two institutions. The in-person participants included many distinguished academics from around Japan as well as our very own Dr Song Liu. Due to the workshops modest size, there was an intimate atmosphere which nurtured many productive research discussions. Whilst staying in Tokyo, we inevitably sampled some Japanese culture, from Izakayas to cherry blossoms and sumo wrestling!

We thought we’d share some of our thoughts and experiences. We’ll first go through some of our most memorable talks, and then talk about some of our activities outside the workshop.

Talks

Sho Sonoda – Ridgelet Transforms for Neural Networks on Manifolds and Hilbert Spaces

We particularly enjoyed the talk given by Sho Sonoda, a Research Scientist from the Deep Learning Theory group at Riken AIP on “Ridgelet Transforms for Neural Networks on Manifolds and Hilbert Spaces.” Sonoda’s research aims to demystify the black box nature of neural networks, shedding light on how they work and their universal approximation capabilities. His talk provided valuable insights into the integral representations of neural networks, and how they can be represented using ridgelet transforms. Sonoda presented a reconstruction formula from which we see that if a neural network can be represented using ridgelet transforms, then it is a universal approximator. He went on to demonstrate that various types of networks, such as those on finite fields, group convolutional neural networks (GCNNs), and networks on manifolds and Hilbert spaces, can be represented in this manner and are thus universal approximators. Sonoda’s work improves upon existing universality theorems by providing a more unified and direct approach, as opposed to the previous case-by-case methods that relied on manual adjustments of network parameters or indirect conversions of (G)CNNs into other universal approximators, such as invariant polynomials and fully-connected networks. Sonoda’s work is an important step toward a more transparent and comprehensive understanding of neural networks.

Greg Yang – The unreasonable effectiveness of mathematics in large scale deep learning

Greg Yang is a researcher at Microsoft Research who is working on a framework for understanding neural networks called “tensor programs”. Similar to Neural Tangent Kernels and Neural Network Gaussian Processes, the tensor program framework allows us to consider neural networks in the infinite-width limit, where it becomes possible to make statements about the properties of very wide networks. However, tensor programs aim to unify existing work on infinite-width neural networks by allowing one to take the infinite limit of a much wider range of neural network architectures using one single framework.

In his talk, Yang discussed his most recent work in this area, concerning the “maximal update parametrisation”. In short, they show that in this parametrisation, the optimal hyperparameters of very wide neural networks are the same as those for much smaller neural networks. This means that hyperparameter search can be done using small, cheap models, and then applied to very large models like GPT-3, where hyperparameter search would be too expensive. The result is summarised in this figure from their paper “Tensor Programs V: Tuning Large Neural Networks via Zero-Shot Hyperparameter Transfer”, which shows how this is not possible in the standard parametrisation. This work was only possible by building upon the tensor program framework, thereby demonstrating the value of having a solid theoretical understanding of neural networks.

Statistical Seismology Seminar Series

In addition to the workshop, Sam attended the 88th Statistical Seismology seminar in the Risk Analysis Research Centre at ISM https://www.ism.ac.jp/~ogata/Ssg/ssg_statsei_seminarsE.html. The Statistical Seismology Research Group at ISM was created by Emeritus Professor Yosihiko Ogata and is one of the leading global research institutes for statistical seismology. Its most significant output has been the Epidemic-Type Aftershock Sequence (ETAS) model, a point process based earthquake forecasting model that has been the most dominant model for forecasting since its creation by Ogata in 1988.

As part of the Seminar series, Sam gave a talk on his most recent work (Forecasting the 2016-2017 Central Apennines Earthquake Sequence with a Neural Point Process’, https://arxiv.org/abs/2301.09948) to the research group and other visiting academics.

Japan’s interest is earthquake science is due to the fact that they record the most earthquakes in the world. The whole country is in a very active seismic area, and they have the densest seismic network. So even though they might not actually have the most earthquakes in the world (which is most likely Indonesia) they certainly document the most. The evening before flying back to the UK, Sam and Jack felt a magnitude 5.2 earthquake 300km north of Tokyo in the Miyagi prefecture. At that distance all that was felt was a small shudder…

Japan

It’s safe to say that the abundance of delicious food was the most memorable aspect of our trip. In fact, we never had a bad meal! Our taste buds were taken on a culinary journey as we tried a variety of Japanese dishes. From hearty, broth-based bowls of ramen and tsukemen, to fun conveyor-belt sushi restaurants, and satisfying tonkatsu (breaded deep-fried pork cutlet) with sticky rice or spicy udon noodles, we were never at a loss for delicious options. We even had the opportunity to cook our own food at an indoor barbecue!

Aside from the food, we thoroughly enjoyed our time in Tokyo – exploring the array of second-hand clothes shops, relaxing in bath-houses, and trying random things from the abundance of vending machines.


Compass students at AISTATS 2023

Congratulations to Compass students Josh Givens, Hannah Sansford and Alex Modell who, along with their supervisors have had their papers accepted to be published at AISTATS 2023.


‘Implications of sparsity and high triangle density for graph representation learning’

Hannah Sansford, Alexander Modell, Nick Whiteley, Patrick Rubin-Delanchy

Hannah: In this paper we explore the implications of two common characteristics of real-world networks, sparsity and triangle-density, for graph representation learning. An example of where these properties arise in the real-world is in social networks, where, although the number of connections each individual has compared to the size of the network is small (sparsity), often a friend of a friend is also a friend (triangle-density). Our result counters a recent influential paper that shows the impossibility of simultaneously recovering these properties with finite-dimensional representations of the nodes, when the probability of connection is modelled by the inner-product. We, by contrast, show that it is possible to recover these properties using an infinite-dimensional inner-product model, where representations lie on a low-dimensional manifold. One of the implications of this work is that we can ‘zoom-in’ to local neighbourhoods of the network, where a lower-dimensional representation is possible.

The paper has been selected for oral presentation at the conference in Valencia (<2% of submissions). 


Density Ratio Estimation and Neyman Pearson Classification with Missing Data

Josh Givens, Song Liu, Henry W J Reeve

Josh: In our paper we adapt the popular density ratio estimation procedure KLIEP to make it robust to missing not at random (MNAR) data and demonstrate its efficacy in Neyman-Pearson (NP) classification. Density ratio estimation (DRE) aims to characterise the difference between two classes of data by estimating the ratio between their probability densities. The density ratio is a fundamental quantity in statistics appearing in many settings such as classification, GANs, and covariate shift making its estimation a valuable goal. To our knowledge there is no prior research into DRE with MNAR data, a missing data paradigm where the likelihood of an observation being missing depends on its underlying value. We propose the estimator M-KLIEP and provide finite sample bounds on its accuracy which we show to be minimax optimal for MNAR data. To demonstrate the utility of this estimator we apply it the the field of NP classification. In NP classification we aim to create a classifier which strictly controls the probability of incorrectly classifying points from one class. This is useful in any setting where misclassification for one class is much worse than the other such as fault detection on a production line where you would want to strictly control the probability of classifying a faulty item as non-faulty. In addition to showing the efficacy of our new estimator in this setting we also provide an adaptation to NP classification which allows it to still control this misclassification probability even when fit using MNAR data.

Student Perspectives: Contemporary Ideas in Statistical Philosophy

A post by Alessio Zakaria, PhD student on the Compass programme.

Introduction

Probability theory is a branch of mathematics centred around the abstract manipulation and quantification of uncertainty and variability. It forms a basic unit of the theory and practice of statistics, enabling us to tame the complex nature of observable phenomena into meaningful information. It is through this reliance that the debate over the true (or more correct) underlying nature of probability theory has profound effects on how statisticians do their work. The current opposing sides of the debate in question are the Frequentists and the Bayesians. Frequentists believe that probability is intrinsically linked to the numeric regularity with which events occur, i.e. their frequency. Bayesians, however, believe that probability is an expression of someones degree of belief or confidence in a certain claim. In everyday parlance we use both of these concepts interchangeably: I estimate one in five of people have Covid; I was 50% confident that the football was coming home. It should be noted that the latter of the two is not a repeatable event per se. We cannot roll back time to check what the repeatable sequence would result in.

(more…)

Skip to toolbar