A post by Xinrui Shi, PhD student on the Compass programme.
Introduction
Meta-analysis is a widely used statistical method for combining evidence from multiple independent trials that compare the same pair of interventions [1]. It is mainly used in medicine and healthcare but has also been applied in other fields, such as education and psychology. In general, it is assumed that there is a numerical measure of effectiveness associated with each intervention, and the goal is to estimate the difference in effectiveness between the two interventions. In medicine, this difference is termed the relative treatment effect. We assume that relative effects vary across trials but are drawn from some shared underlying distribution. The objective is to estimate the mean and standard deviation of this distribution, which we denote by $d$ and $\tau$ respectively; $\tau$ is referred to as the heterogeneity parameter.
In medical trials, patients are randomly allocated to one of the two treatment options, and their subsequent health outcomes are monitored. Each trial then provides an observation of the relative treatment effect in that trial. Meta-analysis uses these observations to estimate the mean $d$ and variance $\tau^2$ of the distribution of relative effects. In this work, we are interested in understanding what conditions maximise the precision of these pooled estimates.
It is well-known that the precision of meta-analysis can be improved by either increasing the number of observations or improving the precision of individual observations. Both approaches, however, require more participants to be included in the meta-analysis. To understand the relative importance of these factors, we constrain the total number of participants to a fixed value. Then, if more trials are conducted to generate additional observations, each trial will necessarily include fewer participants, thereby reducing the precision of each individual observation. Given this trade-off between the precision of observations and their quantity, we ask: how should participants be optimally partitioned across trials to achieve the most precise estimates?
Meta-analysis background
Model
Suppose there are two treatments for a disease, labelled $T_1$ and $T_2$, and we want to know which one is more effective. There are a total of $n$ patients across $M$ trials, and patients in each trial are randomly allocated to one of the two treatments. We write $n_{ij}$ for the number of patients assigned to treatment $T_j$ in trial $i\in \{ 1,\ldots,M \}$.
Outcomes refer to a patient’s health status after treatment. Here, we assume a binary outcome, either recovered or not recovered. A natural measure of the effectiveness of a treatment is the probability of recovery. Let $p_{ij}$ denote the probability of recovery after receiving treatment $T_j$ in trial $i$, and $X_{ij}$ the number of these patients who recover. We assume that outcomes are independent across patients. It then follows that $X_{{ij}}$ has a Binomial distribution,
\[eq(1):\quad X_{{ij}} \sim \text{Binomial}(n_{ij}, p_{ij}).\]
Due to differences in trial populations and procedures, the recovery probabilities are not assumed to be the same across trials. Instead, we assume the exchangeability of relative effects.
We model relative treatment effects on the continuous scale. Therefore, we transform $p_{ij}$ to its log-odds,
\begin{equation*}
\quad Z_{ij} := \text{logit}(p_{ij}) = \log \frac{p_{ij}}{1-p_{ij}}
\label{eq:def_Zij}
\end{equation*}
and define the trial-specific relative treatment effect, $\Delta_{i,12}$, as the log odds ratio (LOR) between the two treatments in this trial,
\begin{equation}\label{eq:LOR}
eq(2):\quad \Delta_{i,12}:= Z_{i2}- Z_{i1}=\log \frac{p_{i2}(1-p_{i1})}{p_{i1}(1-p_{i2})}.
\end{equation}
In words, $\Delta_{i,12}$ represents the effect of $T_2$ relative to $T_1$ in the $i$-th trial; $\Delta_{i,12}>0$ indicates that $T_2$ is more effective than $T_1$.
The random effects (RE) model assumes that the treatment effects vary across trials,
\begin{equation}
eq(3):\quad \Delta_{i,12}\sim \text{Normal}(d_{12},\tau^2),
\label{eq:normal_assump2}
\end{equation}
where $d_{12}$ represents the true mean of relative treatment effects between $T_1$ and $T_2$. The fixed effect (FE) model is a special case of the RE model, in which the relative treatment effects in all trials are assumed to be equal, i.e, $\tau=0$ and $\Delta_{i,12} \equiv d_{12}$ for all $i \in \{1,\ldots,M\}$.
Data
To achieve the primary goal of estimating $d_{12}$ and $\tau$, we first derive expressions for the relative treatment effects in each trial from the available data.
We write $r_{ij}$ for the realisation of the random variable $X_{ij}$. The observed relative treatment effect in the $i$-th trial is then
\[
\hat{\Delta_{i,12}} = \log\frac{n_{i2}(n_{i1}-r_{i1})}{n_{i1}(n_{i2}-r_{i2})}.
\]
It can be shown for our binomial model that, as the numbers of patients $n_{i1}$ and $n_{i2}$ grow large, the distribution from which $\hat{\Delta_{i,12}}$ is sampled is asymptotically normal, centred on the true trial-specific effect $\Delta_{i,12}$ and with a sampling variance $\sigma_i^2$ that can be explicitly expressed in terms of $n_{i1}$, $n_{i2}$, and the unknown parameters $p_{i1}$ and $p_{i2}$. The true variance $\sigma^2_i$ is thus unknown, but can be estimated as follows,
\begin{equation}
eq(4): \quad \hat{\sigma^2_i} = \frac{1}{r_{i1}} +\frac{1}{n_{i1}-r_{i1}} +\frac{1}{r_{i2}} +\frac{1}{n_{i1}-r_{i2}}.
\end{equation}
In many practical applications of meta-analysis, it is only the relative treatment effects and their estimated variance that are reported in individual studies, and not the raw data. Hence, meta-analysis often starts by treating $\hat{\Delta_{i,12}}$ and $\hat{\sigma^2_i}$ as the primary data from the $i$-th trial. The goal is then to aggregate data across trials to estimate $d_{12}$, the true treatment effect.
Estimating model parameters
The estimate of $d_{12}$ is given by the weighted mean of estimates from each trial,
\begin{equation}\label{eq:d-hat}
eq(5): \quad\hat{d}_{12} = \frac{\sum_{i=1}^M w_i \hat{\Delta_{i,12}}} {\sum_{i=1}^M w_i }.
\end{equation}
The usual choice of the weight $w_i$ is the inverse of the variance estimate associated with trial $i$. For the FE model this is $w_i = \hat{\sigma_i^{-2}}$, and for the RE model, $w_i = 1/(\hat{\sigma_i^{2}}+\hat{\tau^2})$; here, $\hat{\sigma_i^2}$ is given in (4) and $\hat{\tau^2}$ in (7) below. The choice of inverse variance weights minimises the variance of the estimator $\hat{d_{12}}$, as can be shown using Lagrange multipliers. Substituting these weights in (5) and computing the variance, we obtain that
\begin{equation}
\label{eq:optimised_var}
eq(6): \quad \mbox{Var}(\hat{d_{12}}) =\frac{1}{M} \left( \frac{1}{M} \sum_{i=1}^M \frac{1}{\mbox{Var}(\hat{\Delta_{i,12}})} \right)^{-1},
\end{equation}
where $\mbox{Var}(\hat{\Delta_{i,12}})$ $=\hat{\sigma^2_i}$ in the FE model and $\hat{\sigma^2_i}+\hat{\tau^2}$ in the RE model, as noted above. In words, the variance of the meta-analysis estimate of the treatment effect is the scaled (by $1/M$) harmonic mean of the variances from the individual trials.
One class of methods for estimating the unknown heterogeneity parameter, $\tau$, is the so-called `method of moments’ [2], which equates the empirical between trial variance with its expectation under the random effects model. The widely-used DerSimonian and Laird (DL) [1] estimator is a specific implementation of the method of moments given by
\begin{equation}
eq(7): \quad \hat{\tau^2} = \frac{\sum_{i=1}^M\hat{\sigma_i^{-2}}\left(
\hat{\Delta_{i,12}} – \frac{\sum_{l=1}^M \hat{\sigma_l^{-2}}\hat{\Delta_{l,12}}}{\sum_{l=1}^M \hat{\sigma_l^{-2}}}
\right)^2 – (M-1)}{\sum_{i=1}^M\hat{\sigma_i^{-2}} – \frac{\sum_{i=1}^M\hat{\sigma_i^{-4}}}{\sum_{i=1}^M\hat{\sigma_i^{-2}}}}.
\label{eq:DL_tau2}
\end{equation}
The right-hand side of the above formula can be negative, in which case $\hat{\tau^2}$ is set to zero.
Optimal partitioning of patients
Our aim is to determine the optimal allocation of participants across trials that yields the most precise meta-analysis estimates. We first address this analytically by seeking the allocation that minimises the variance of $\hat{d_{12}}$ in an asymptotic regime in which the number of patients tends to infinity. We complement the theoretical analysis with simulations over a wide range of numbers of patients.
Theoretical findings
To obtain analytic results, we make two simplifying assumptions. First, we assume that each trial, and each treatment within each trial, involves the same number of participants, i.e., $n_{ij}=\frac{n}{2M} \hspace{3pt}$ for all $\{i,j\}$. Then, we consider a limit as the total number of participants, $n$, as well as the number in each trial, $n/M$, tend to infinity. In this limiting regime, the observed number of recoveries, $r_{ij}$, in each arm and trial, satisfies $r_{ij}=np_{ij}/2M$, where $p_{ij}$ is the true probability of recovery. substituting this in (4) yields
\begin{equation} \label{eq:var_est_symm}
eq(8): \quad \hat{\sigma}^2_i = \frac{2Ma_i}{n}, \mbox{ where } a_i=\frac{1}{p_{i1}}+\frac{1}{1-p_{i1}}+\frac{1}{p_{i2}}+\frac{1}{1-p_{i2}}.
\end{equation}
By approximating the asymptotic distribution of $\hat{d_{12}}$, the problem of minimising the variance of $\hat{d}_{12}$ is transferred into to the following optimisation problem:
\begin{equation*}
\max_{M, \tau} \left[\sum_{i=1}^M \frac{1}{2Mna_i+\tau^2}\right], \quad a_i := \frac{1}{p_{i1}(1-p_{i1})}+\frac{1}{p_{i2}(1-p_{i2})}.
\label{eq:opt_problem_asymtotic}
\end{equation*}
Fixed effects: Under the FE model, $\tau=0$ and the optimization problem reduces to
\[
\max_M \left[\frac{1}{2M}
\sum_{i=1}^M \frac{1}{a_i}
\right].
\]
Assuming the values of $a_i$ are roughly of the same order of magnitude, we approximate
$$\sum_{i=1}^M \frac{1}{a_i} \approx \frac{M}{\bar{a}}, \quad \bar{a} := \frac{1}{M}\sum_{i=1}a_i.$$
Hence, the objective function is independent of $M$, indicating that the partitioning of participants does not influence the precision of estimation. This result aligns with our expectation, as, in the FE model, we are only estimating the mean of the distribution and not the variance.
Random effects: In the RE model, we must also estimate the between-trial variance $\tau^2$, which is working in progress.
Empirical findings
To assess whether findings based on asymptotic performance hold in practical scenarios, we conduct a simulation study involving a total of 20,000 participants. We vary the number of trials, $M$, in unit steps from 1 to 200. The number of participants assigned to each treatment in each trial, $n_{i1}=n_{i2}$, therefore varies from 10,000 to 50. We set the true relative treatment effect equal to $d_{12}=0.05$, with heterogeneity parameter $\tau=0.1$ for the RE model.
Data simulation: For each $M$ (and corresponding $n_{i1}=n_{i2}$), we sample trial-specific relative effects $\Delta_{i,12}$ from Equation (3). To construct the corresponding recovery probabilities, we sample $p_{i,1}$ from a standard uniform distribution and calculate $p_{i,2}$ by rearranging Equation (2) to give
\[
p_{i,2} = \frac{p_{i,1}e^{\Delta_{i,12}}}{1 + p_{i,1}(e^{\Delta_{i,12}}-1)}.
\]
Finally, we simulate the number of recovered patients, $r_{ij}$, from the binomial distribution in Equation (1). This yields the simulated data set,
$$\mathcal{D}= \left\{
(r_{i,j},n_{i,j}): i \in\{1,\ldots,M\}, j\in\{1,2\}
\right\},$$
which we use to estimate the model parameters via Equations (5) and (7).
For each $M$, we repeat the simulation 100 times and calculate the median and the interquartile range (IQR) of the estimates $\hat{d_{12}}$ and $\hat{\tau}$.
Estimation of $\hat{d}_{12}$ in FE model: The following figure shows the median and IQR of the estimated mean relative treatment effect $\hat{d}_{12}$ and its standard error for the FE model. As $M$ increases, the standard error on $\hat{d}_{12}$ increases while its estimate fluctuates around the true parameter value. This indicates that the FE estimate $\hat{d}_{12}$ becomes less precise as participants are partitioned into more trials (with fewer participants in each).

Estimation of $\hat{d}_{12}$ in RE model: The following figure shows the estimated mean and standard error of the relative treatment effect in the RE model. As before, the estimated mean is not affected by the number of trials. The standard error exhibits an initial sharp increase from $M=1$ (one large trial) and then decreases until the number of trials reaches approximately 40. After this, the standard error remains almost fixed. This indicates that for more than one trial, the estimated mean relative treatment effect is more precise when participants are partitioned into more trials.

Estimation of $\hat{\tau}$ in RE model: The following figure shows the estimated mean and standard error of the heterogeneity estimate $\hat\tau$ in the RE model. For very few trials ($M<6$), heterogeneity is underestimated (at $M=1$ this is zero since there can be no variation between one trial). As the number of trials increases, $\hat\tau$ fluctuates about its true value but with increasing variation (IQR). Beyond $M=1$ (where the standard error is necessarily zero), the standard error on $\hat{\tau}$ decreases with increasing $M$ up to approximately $M=10$, at which point it increases again. This suggests that, for the scenario simulated in this study, the precision of the heterogeneity estimate is optimal when participants are partitioned into about 10 trials (with $n_{i1}=n_{i2}=1000$).

Summary: Even with a large number of participants, the theoretical results only hold for a smaller number of trials. This is because the number of participants per trial decreases when partitioning into more trials.
Future work: As our simulation only extended to 200 trials, it did not investigate scenarios with small numbers of participants per trial. In future work we will explore these more extreme scenarios, taking the number of trials to its maximum (i.e. with one participant per treatment in each trial). We will also investigate the generalizability of our findings to other parameter values ($d_{12}$ and $\tau$), continuous rather than binary outcomes, and Bayesian inference methods.
Reference
[1] Rebecca DerSimonian and Nan Laird. Meta-analysis in clinical trials. Controlled clinical trials, 7(3):177–188, 1986.
[2] Rebecca DerSimonian and Raghu Kacker. Random-effects model for meta-analysis of clinical trials: an update. Contemporary clinical trials, 28(2):105–114, 2007.


 with a particular sequence, we can take a sample from this synthesis and analyse it via mass spectrometry. In this process, molecules in the sample are first fragmented — broken apart into ions — and these charged fragments are then passed through an electromagnetic field. The trajectory of each fragment through this field depends on its mass/charge ratio (m/z), so measuring these trajectories (e.g. by measuring time of flight before hitting some detector) allows us to calculate the m/z of fragments in the sample. This gives us a discrete mass spectrum: counts of detected fragments (intensity) across a range of m/z bins [5].
 every product of a single fragmentation of
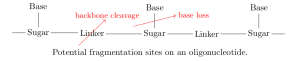
 , where
  is the intensity in the
  bin. For a set
  of possible fragments, let
  be the amount of
  that is actually present. We would like to estimate the amounts of each fragment based on the spectrum
  .
. and
and  and this produced a spectrum
  , we can say the intensity contributed to bin
  by
by  In mass spectrometry, the intensity in a single bin due to a single fragment is linear in the amount of that fragment, and the intensities in a single bin due to different fragments are additive, so in some general spectrum we have
 such that
  (so the columns of
  correspond to fragments in
  solves
  . In practice this exact solution is not found — due to experimental noise and potentially because there are contaminant fragments in the sample not included in
  for which
  is close to
  -normalise these columns, meaning the total intensity (over all bins) of each fragment in the library matrix is uniform, and so the values in
  can be directly interpreted as relative abundances of each fragment.
 which maximises the likelihood of the system is approximated by the iterative formula
}=\left(\mathbf A^T \frac{\mathbf b}{\mathbf{A\hat x}^{(t)}}\right)\odot \mathbf{\hat x}^{(t)}.")
 represent (respectively) elementwise division and multiplication of two vectors. This is known as the Richardson-Lucy algorithm [9].
}=\left(\mathbf A^T \frac{\mathbf b}{\mathbf{A\hat x}^{(t)}}\right)\odot \frac{ \mathbf{\hat x}^{(t)}}{\mathbf 1 + \lambda},")
 is a regularisation parameter [10].
 , we smooth and bin the m/z values of the most abundant isotopes of
  , and store these values in the columns of
  ) for clarity.
 . That is, the dimension of the embeddings (
 ) is much smaller than the number of items or users. The hope is that the position of these embeddings captures some of the latent (hidden) structure of the items/users, and so similar items end up ‘close together’ in the embedding space. What is meant by being ‘close’ may be specified by some similarity measure.
 users
users ") and a group of
and a group of  items
items ") . Then we let
. Then we let  be the ratings matrix where position
  represents whether user
  interacts with item
  is very sparse, since most users only interact with a small subset of the full item set
  . For any items
  , and item embeddings,
  , is Matrix Factorisation. The idea is to find low-rank embeddings such that the product
  is a good approximation to the ratings matrix
  = \sum_{u, i} \left(R_{ui} - \langle X_u, Y_i \rangle \right)^2.")
 .
. and
and  , we can look at the row of
  , i.e.
,")
 and
and  ,
,}{1 + \exp(\langle X_u, Y_i \rangle + \beta_u + \beta_i)} \right).")