
A post by Dominic Broadbent and Dom Owens, PhD students on the Compass CDT, and Compass conference co-organisers.
Introduction
September saw the first annual Compass Conference, hosted in the newly refurbished Fry Building, home to the School of Mathematics. The conference was a fantastic opportunity for PhD students across Compass to showcase their research, meet with industrial partners and to celebrate their achievements. The event also welcomed the new cohort of PhD students, as well as prospective PhD students taking part in the Access to Data Science programme.
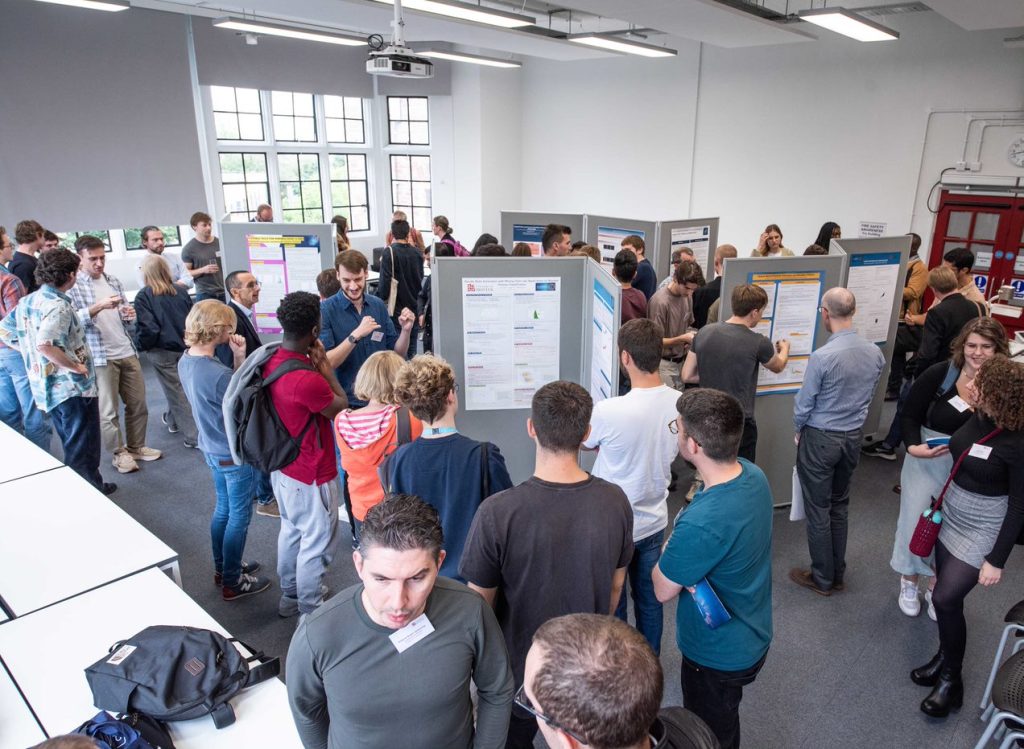
Lightning talks and poster session
The day started with a series of 3-minute fast-paced lightning talks, where students pitched their research to attendees to come and visit them at the following poster session. More than 20 posters were on display, capturing the wide range of topics Compass students currently work on. The session gave everyone a chance to dive into the finer details and see results visualised in impressive and inventive ways. For academic and industry attendees, this also served as a forum to propose potential applications and collaborations.
The lightning talks were a great exercise in boiling down your work into just the essentials, knowing you only have a short time to try attract the audience’s attention and interest. While the poster session provided an opportunity to follow up on that interest with details and results, as well as the chance to to see what exactly everyone else in the office is working on!
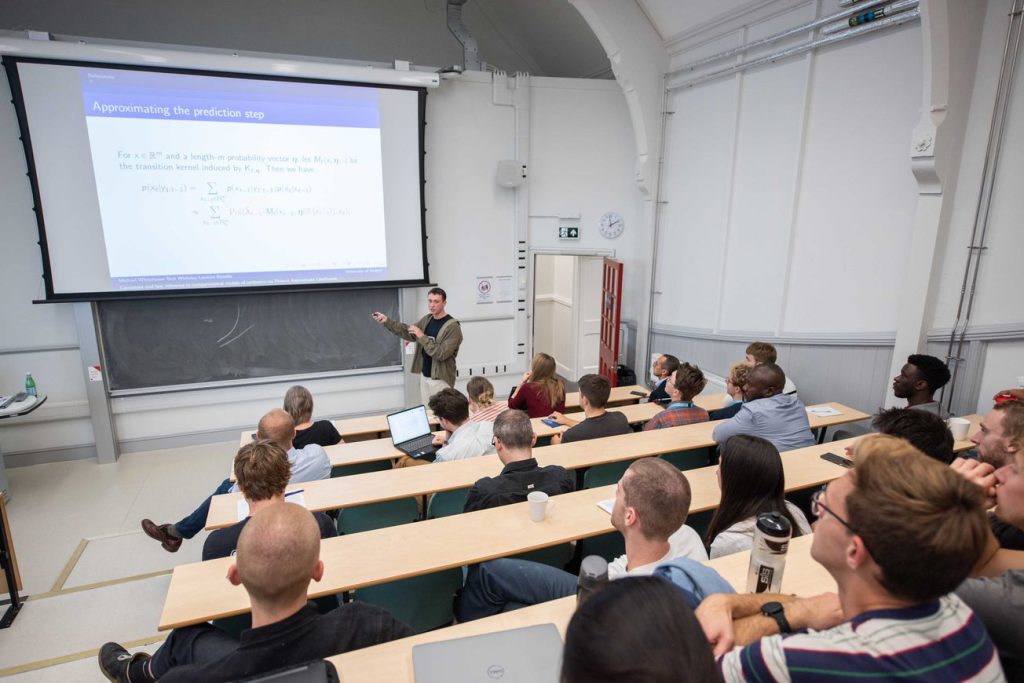
Research talks
After lunch, we saw 6 in-depth talks from students on late-stage or published research ideas, starting with Ettore Fincato’s work “Spectral analysis of the Gibbs sampler with the concept of conductance” and ending with Ed Davis’ “Universal Dynamic Network Embedding – How to Comprehend Changes in 20,000 Dimensions”. Our speakers took advantage of the longer format to give detailed, motivated presentations, concentrating on the most interesting mathematical details while still making sure their talks were accessible for everyone in the audience. Having a chaired discussion after each talk allowed for audience participation and gave more focus to the most interesting and challenging details. The format is intended to be similar to the talks students give at external conferences, giving the speakers a chance to perfect their technique in front of friendly faces.
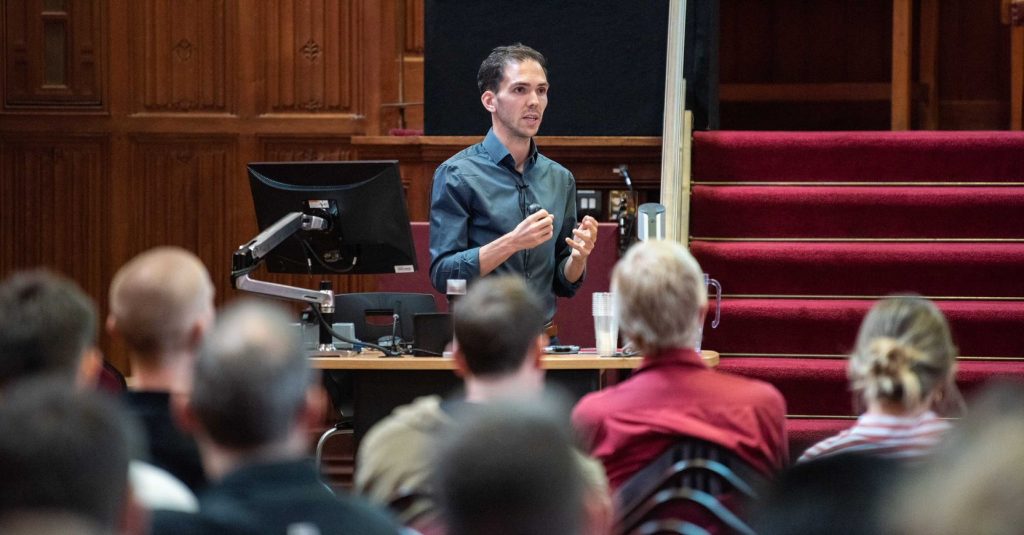
Special guest lecture
To cap off a successful event, the attendees moved to the great hall of the Wills Memorial Building which opened its doors to the public for a special guest lecture from John Burn-Murdoch, the Chief Data Officer at the Financial Times. John is a pioneering data journalist whose work came to particular prominence when he led the FT’s coverage of the Covid-19 pandemic. He also writes a weekly column, Data Points, where he leverages the power of data visualisation done well to inform his readers on topics such as economics, sport and health.
The lecture, titled Making charts that make an impact, was an exploration of what makes data visualisation effective as a means of communication, drawing on the latest scientific research and his experience of visualising the pandemic. It provided an excellent opportunity to learn how we can carefully present data to have the largest impact, and get across the ideas we want. Certainly, it sparked a discussion into the nature of data visualisation in mathematical research, what we can learn from the latest advances in data journalism, and when it may and may not be appropriate to tell a story.
Thoughts from students
We surveyed the Compass students afterwards looking for feedback on their experiences. Here are a select few comments:
“Giving a talk on my work in an encouraging environment, with support from my friends and advisers, as well as a wide range of attendees with diverse technical knowledge, was an invaluable experience for me.”
“It’s really useful to learn how to communicate your research to people in industry. They tend to be less concerned with detail, and more concerned with the big idea, and how it can be used in practice. I’m looking forward to continuing some of the conversations I started while at the conference and seeing where they lead.”
“I had a very rewarding time at the Compass conference, the great mix of people, ideas, and catering made it so fun and interesting. Really looking forward to next year’s!”
“I found John’s talk fascinating, it was very interesting to peek behind the curtain and gain insight into the way a data journalist makes decisions on how to present data most effectively, from the minutiae to the big picture.”