
A post by Dan Milner, PhD student on the Compass programme.
Introduction
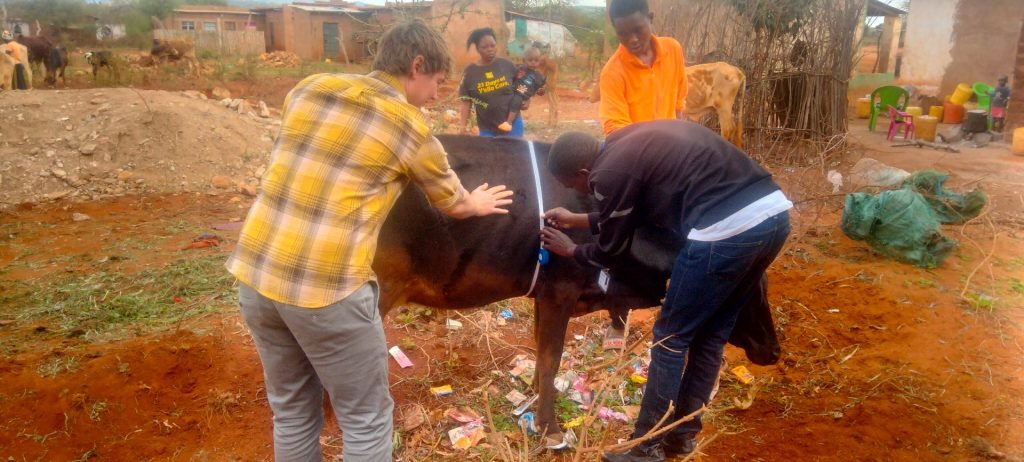
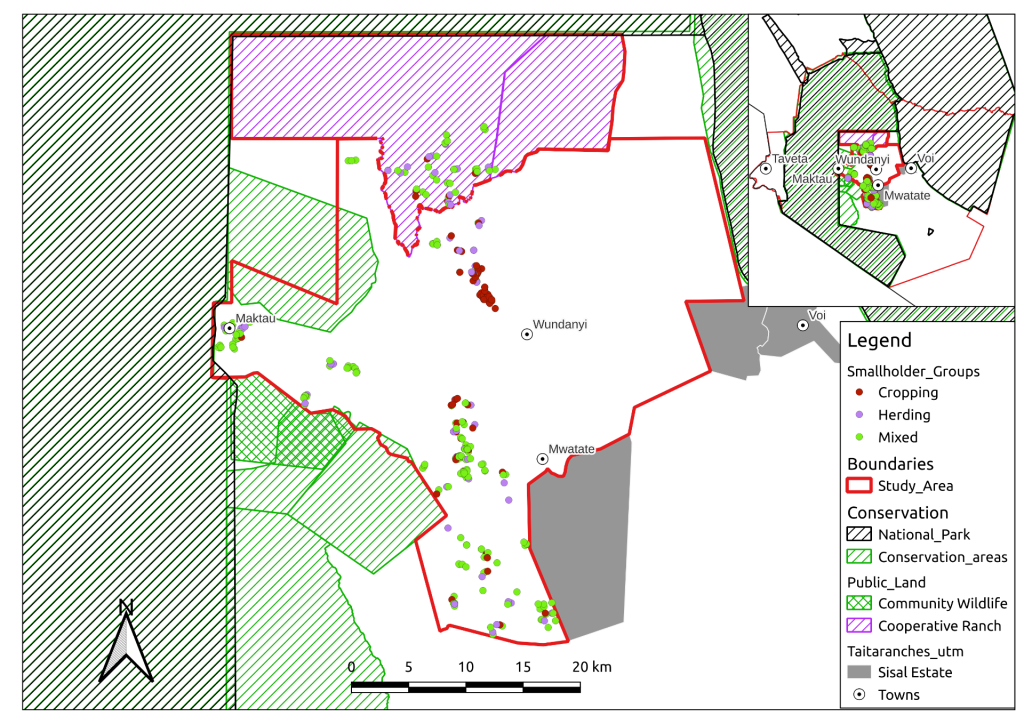
This blog describes an approach being developed to deliver rapid classification of farmer strategies. The data comes from a survey conducted with two groups of smallholder farmers (see image 2), one group living in the Taita Hills area of southern Kenya and the other in Yebelo, southern Ethiopia. This work would not have been possible without the support of my supervisors James Hammond, from the International Livestock Research Institute (ILRI) (and developer of the Rural Household Multi Indicator Survey, RHoMIS, used in this research), as well as Andrew Dowsey, Levi Wolf and Kate Robson Brown from the University of Bristol.
Aims of the project
The goal of my PhD is to contribute a landscape approach to analysing agricultural systems. On-farm practices are an important part of an agricultural system and are one of the trilogy of components that make-up what Rizzo et al (2022) call ‘agricultural landscape dynamics’ – the other two components being Natural Resources and Landscape Patterns. To understand how a farm interacts with and responds to Natural Resources and Landscape Patterns it seems sensible to try and understand not just each farms inputs and outputs but its overall strategy and component practices.
Using data from over 700 farm surveys, each with over 1000 variables, I set out to identify key practices that might help us understand the different farm strategies being used across the two areas. The process involved the following steps:
- Plot, Plot and Plot Again: I split the data into small geographic areas (sub study-sites) and then plotted and mapped responses to every question in the survey.
- Feature Selection: Each plot and map was interrogated to identify variables in each sub-site that appear to define farmer practices.
- Spectral Clustering: Finally, retaining only the selected features I used spectral clustering to try and group the farms into clusters.
Results
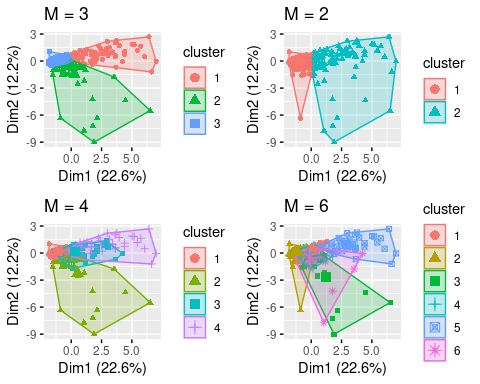
Spectral Clustering
Spectral clustering uses information from the eigenvalues of a Graph Laplacian matrix, 


To construct 


")
with

The number of clusters, 


Hyperparameted 

Farm Strategies
With 

Future Plans
Early results are promising and have been corroborate through site visits. However, there is much room for improvement:
- Firstly, I would like to automate and quantitatively justify feature selection, possibly via a Geographicaly weighted PCA or Multiple Correspondence Analysis approach.
- Secondly, there are much more sophisticated approaches to spectral clustering, for example
As for next steps, I want to look at the resilience of each farm strategy to changes in the environment, a particularly pertinent issue in the face of a changing climate.
Contact details and Links
Please feel free to get in-touch: dan.milner@bristol.ac.uk and if you would like to find-out more about the RHoMIS survey used please visit www.rhomis.org/