Student perspectives: Extending multilevel network meta-regression to disconnected networks and single-arm studies

A post by Sam Perren, PhD student on the Compass programme.

Over the past year, my research has been focused on a method called network meta-analysis (NMA), which is widely used in healthcare decision-making to summarise evidence on the relative effectiveness of different treatments. In particular, I have been interested in the challenges presented by disconnected networks of evidence and single-arm studies and aim to extend the multinma package to handle these challenges. Recently, I presented at the International Society for Clinical Biostatistics (ISCB) conference in Thessaloniki, Greece. In this blog post, I will outline the key points from that presentation and discuss the latest developments from my research.

Network meta-analysis

Network Meta-Analysis (NMA) pools summary treatment effects from randomised control trials (RCTs) to estimate relative effects between multiple treatments [1]. NMA summarises all direct and indirect evidence about treatment effects, allowing comparisons to be made between all pairs of treatments [2]. Covariates such as age, biomarker status, or disease severity can be either Effect Modifiers that interact with treatment effects, or Prognostic Factors that predict outcomes without interacting with treatment effects[3]. NMA requires a connected network, either directly or indirectly, through a series of comparisons[4]. Plot 1 demonstrates the assumption in NMA of constancy of relative effects, that is, the AB effect observed in study AB would be exactly the same in study AC, if a B arm had been included. However, this assumption can break down if there are differences in effect modifiers between studies which can lead to bias.[6].


Plot 1: Simple scenario with A versus B and A versus C study: we assume constancy of relative effects when making an indirect comparison between treatments B and C via the common A arm

Population adjustments & IPD network meta-regression

Population adjustment methods aim to relax the assumption of constancy of relative effects using available individual level data (IPD) to adjust for differences between study populations[3]. A network where IPD is available from every study enables the use of IPD network meta-regression and is considered the gold standard. However, having all IPD data in a network is rare; some studies may only provide aggregate data (AgD) in published papers.

Multilevel – Network Meta-Regression

Multilevel Network Meta-Regression (ML-NMR) is a population adjustment method that extends the NMA framework to synthesise mixtures of IPD and AgD. ML-NMR can produce estimates from networks of any size and for any given target population. It does this by first defining an individual-level regression model on the IPD, then it averages (integrates) each aggregate study population to form the aggregate level model using efficient and general numerical integration. [5]

Disconnected networks

Healthcare policymakers are increasingly encountering disconnected networks of evidence, which often include studies without control groups (single-arm studies)[6]. Very strong assumptions are required to make comparisons in a disconnected network; such as adjusting for all prognostic factors and all effect modifiers, which may not always be feasible with the available data. Current methods to handle disconnected networks include unanchored Matching-Adjusted indirect comparisons (MAIC)[7] and simulated treatment comparison (STC)[8]. However, these methods have limitations: they cannot generate estimates for target populations outside the network of evidence that might be relevant to decision makers and they are limited to a two study-scenario. So there remains a need for more flexible and robust methods, such as an extended version of the ML-NMR approach, to better handle disconnected networks of evidence.

Example: Plaque Psoriasis

We use a network of 6 active treatments plus placebo all used to treat moderate-to-severe plaque psoriasis, previously analysed by Philippo et al. [9]. In this network, we have AgD from the following studies: CLEAR, ERASURE, FEATURE, FIXTURE, and JUNCTURE. Additionally, we have IPD from the IXORA-S, UNCOVER-1, UNCOVER-2, and UNCOVER-3 studies. Outcomes of interest include success/failure to achieve at least 75%, 90% or 100% improvement on the Psoriasis Area and Severity Index (PASI) scale at 12 weeks compared to baseline, denoted PASI 75, PASI 90, and PASI 100, respectively. We make adjustments for potential effect modifiers, including duration of psoriasis, previous systemic treatment, body surface area affected, weight, and psoriatic arthritis.

Plot 2: Network of studies comparing treatments for moderate-to severe plaque psoriasis. PBO, placebo; IXE, ixekizumab; SEC, secukinumab; ETN, etanercept; UST, ustekinumab. IXE and SEC were each investigated with 2 different dosing regimens.

This network (Plot 2) of evidence is connected; every pair of treatments is joined by a path of study comparisons. We will now disconnect this network to illustrate different methods for reconnecting using ML-NMR, and then compare the results back to the “true” results from the full evidence network. We removed the CLEAR study and removed the placebo arms from the ERASURE, FEATURE, and JUNCTURE studies, as well as the Secukinumab 150 mg and Secukinumab 300 mg arms from the FIXTURE study in the AgD. $N_1$ (Left hand side) shows studies comparing different doses of Secukinumab, 150mg and 300mg, $N_2$ shows studies comparing all other treatments. We are then faced with the challenge of wanting to make valid comparisons between treatments in these two sub-networks, illustrated in Plot 3.

Plot 3: Disconnected network comparing treatments for moderate-to-severe plaque psoriasis

Reconnected network – internal evidence

One approach is to combine two AgD studies from opposite sides of the network into a single study. The Fixture study is the only AgD study in $N_2$. To determine the appropriate study to combine with in $N_1$, aggregate-level matching is used[10]. This involves selecting the study that minimises the Euclidean distance between the observed sets of covariates. Table 1 shows the Erasure study has the most similar characteristics to Fixture. As a result, these two studies will be combined into a new four-arm study, referred to as FIXTURE/ERASURE, effectively bridging the gap in the network.

Table 1: Aggregate level matching results against FIXTURE study.
Plot 4: Reconnected network using aggregate level matching. Combing Fixture and Erasure into one study

Reconnected network – external evidence

Another method we used to reconnect the network is by incorporating external observational studies, specifically “Chiricozzi” and “Prospect,” which observe the effects of Secukinumab 300mg. We incorporated these single-arm studies into the Fixture study as if they were part of the original trial, thereby effectively bridging the network. As a result, we end up with two separate reconnected networks, each using one of the observational studies.

Plot 5: Reconnected network using external control studies

Producing Population-Average Estimates

We have four networks for comparison: Full connected network, Reconnected using single arm study (Chircozzi), Reconnected using single arm study (Prospect), Reconnected using aggregate-level matching (FIXTURE/ERASURE). For each network, we will run both ML-NMR and standard NMA without regression. These analyses will produce population-adjusted relative treatment effects and probability outcomes for achieving a 75% reduction in the Plaque Area Severity Index (PASI75).

The ML-NMR results in the fully connected network will serve as the gold standard. We will compare the results obtained from the different methods (ML-NMR vs. NMA) and across the various networks (Full vs. reconnected) to evaluate the impact of different approaches on the relative treatment effects and outcome probabilities.

Relative Effects vs Placebo

Plot 6: Probit relative treatment effects vs placebo estimates. Target populations in columns, treatments with their disconnected subnetwork in the rows (right-hand side) and reconnected/original networks in the subrows (left-hand side). Coloured by method (MLNMR or NMA)

Plot 6 shows the probit relative treatment effects versus placebo across three populations: Feature ($N_1$), Uncover-1 ($N_2$), and the external population, Prospect. The results demonstrate that for treatments in $N_2$, the estimates produced by both NMA and ML-NMR are generally close to the gold standard. This similarity between NMA and ML-NMR is largely due to the homogeneity of the populations within the networks and the limited covariates we used to match original analysis. However, NMA results show smaller confidence intervals compared to ML-NMR, which may suggest an overconfidence in the NMA model’s results. ML-NMR accounts for more complexity and variability therefore extrapolates results.

For the Prospect population, the NMA results exhibit slight bias, likely due to differences between the external population and the network populations.

Results for treatments in $N_1$ show varying degrees of accuracy when compared to the gold standard in all populations. Among the reconnected networks, the FIXTURE/ERASURE and Prospect reconnected networks perform relatively well, while the Chiricozzi-based network struggles to match the gold standard results. This is due to Chiricozzi differing the most on covariates compared to all other populations.

In other words, when comparisons are made across the created “bridges” in the reconnected networks, bias can be introduced into our results.

Plot 7: Reconnected network highlighting comparisons made over the “bridge”

The plot above is the reconnected plot using PROSPECT and Chiricozzi external studies and shows us what we mean by comparisons across the “bridge”. All results in plot (1) are relative to a placebo (PBO) which is in $N_2$. If we want to make comparisons to the placebo with treatments from $N_1$ we will need to use these generated direct comparisons or “bridges”.

Absolute probability of PASI75

Plot 8: Probability of absolute outcomes of PASI75. Target populations in columns, treatments with their disconnected subnetwork in the rows (right-hand side) and reconnected/original networks in the subrows (left-hand side). Coloured by method (MLNMR or NMA)

In Plot 8, the FEATURE population results are very close to the gold standard for treatments in $N_1$ but results for treatments in $N_2$ show some bias. Unlike in the probit differences, the reference treatment for FEATURE now become Secukinumab 150mg and 300mg (SEC_150 & SEC_300) so in order to estimate absolute outcomes for $N_2$ treatments, we need to use our “bridges”, thereby incurring bias. This narrative is the same for the other 2 population estimates, where UNCOVER-2 is in $N_2$, estimates for treatments in $N_1$ are bias compared to the gold standard, dependent on network used. For PROSPECT, it’s reference treatment is Secukinumab 150mg ($N_1$), therefore results for $N_2$ treatments vary from the gold standard.

Key Findings

When producing estimates across reconnected networks, there’s a risk that the estimates may be biased or deviate from the true value. In our analysis, reconnecting the networks using ML-NMR showed little improvement over NMA. These results highlight the importance of carefully selecting studies to bridge networks and minimise bias. As disconnected networks become more common, it’s clear that better tools for evidence synthesis are needed to ensure reliable results that can inform clinical decisions and improve outcomes.

Future Work

To improve the performance of ML-NMR over NMA,  we will try incorporating more covariates into the regression model. We also plan to conduct a comprehensive simulation study to compare methods under various scenarios and explore additional approaches, such as class effects. Developing methods to assess the strong assumptions required for reconnecting networks will be another priority. Finally, we aim to implement these methods within the multinma package.

References

[1] – Sofia Dias, Anthony E Ades, Nicky J Welton, Jeroen P Jansen, and Alexander J Sutton. Network meta-analysis for decision-making. John Wiley & Sons, 2018.
[2] – Song F, Altman DG, Glenny AM, Deeks JJ. Validity of indirect comparison for estimating efficacy of competing interventions: empirical evidence from published meta-analyses. Bmj. 2003 Mar 1;326(7387):472.
[3] – David M Phillippo, Anthony E Ades, Sofia Dias, Stephen Palmer, Keith R Abrams, and Nicky J Welton. Methods for population-adjusted indirect comparisons in health technology appraisal. Medical decision making, 38(2):200–211, 2018
[4] – Sofia Dias, Alex J Sutton, AE Ades, and Nicky J Welton. Evidence synthesis for decision making 2: a generalized linear modeling framework for pairwise and network meta-analysis of randomized controlled trials. Medical Decision Making, 33(5):607–617, 2013
[5] – David M Phillippo, Sofia Dias, AE Ades, Mark Belger, Alan Brnabic, Alexander Schacht, Daniel Saure, Zbigniew Kadziola, and Nicky J Welton. Multilevel network meta-regression for population- adjusted treatment comparisons. Journal of the Royal Statistical Society. Series A,(Statistics in Society), 183(3):1189, 2020
[6] – John W Stevens, Christine Fletcher, Gerald Downey, and Anthea Sutton. A review of methods for comparing treatments evaluated in studies that form disconnected networks of evidence. Research synthesis methods, 9(2):148–162, 2018
[7] – Signorovitch, James E., et al. “Matching-adjusted indirect comparisons: a new tool for timely comparative effectiveness research.” Value in Health 15.6 (2012): 940-947.
[8] – Caro JJ, Ishak KJ. No head-to-head trial? Simulate the missing arms. Pharmacoeconomics. 2010;28(10):957–67.
[9] – David M Phillippo, Sofia Dias, AE Ades, Mark Belger, Alan Brnabic, Daniel Saure, Yves Schy-mura, and Nicky J Welton. Validating the assumptions of population adjustment: application of multilevel network meta-regression to a network of treatments for plaque psoriasis. Medical Decision Making, 43(1):53–67, 2023
[10] – Leahy, Joy, et al. “Incorporating single‐arm evidence into a network meta‐analysis using aggregate level matching: assessing the impact.” Statistics in medicine 38.14 (2019): 2505-2523.

Compass students at ICLR 2024

Congratulations to Compass students Edward Milsom and Ben Anson who, along with their supervisor, had their paper accepted for a poster at ICLR 2024.


Convolutional Deep Kernel Machines

Edward Milsom, Ben Anson, Laurence Aitchison 

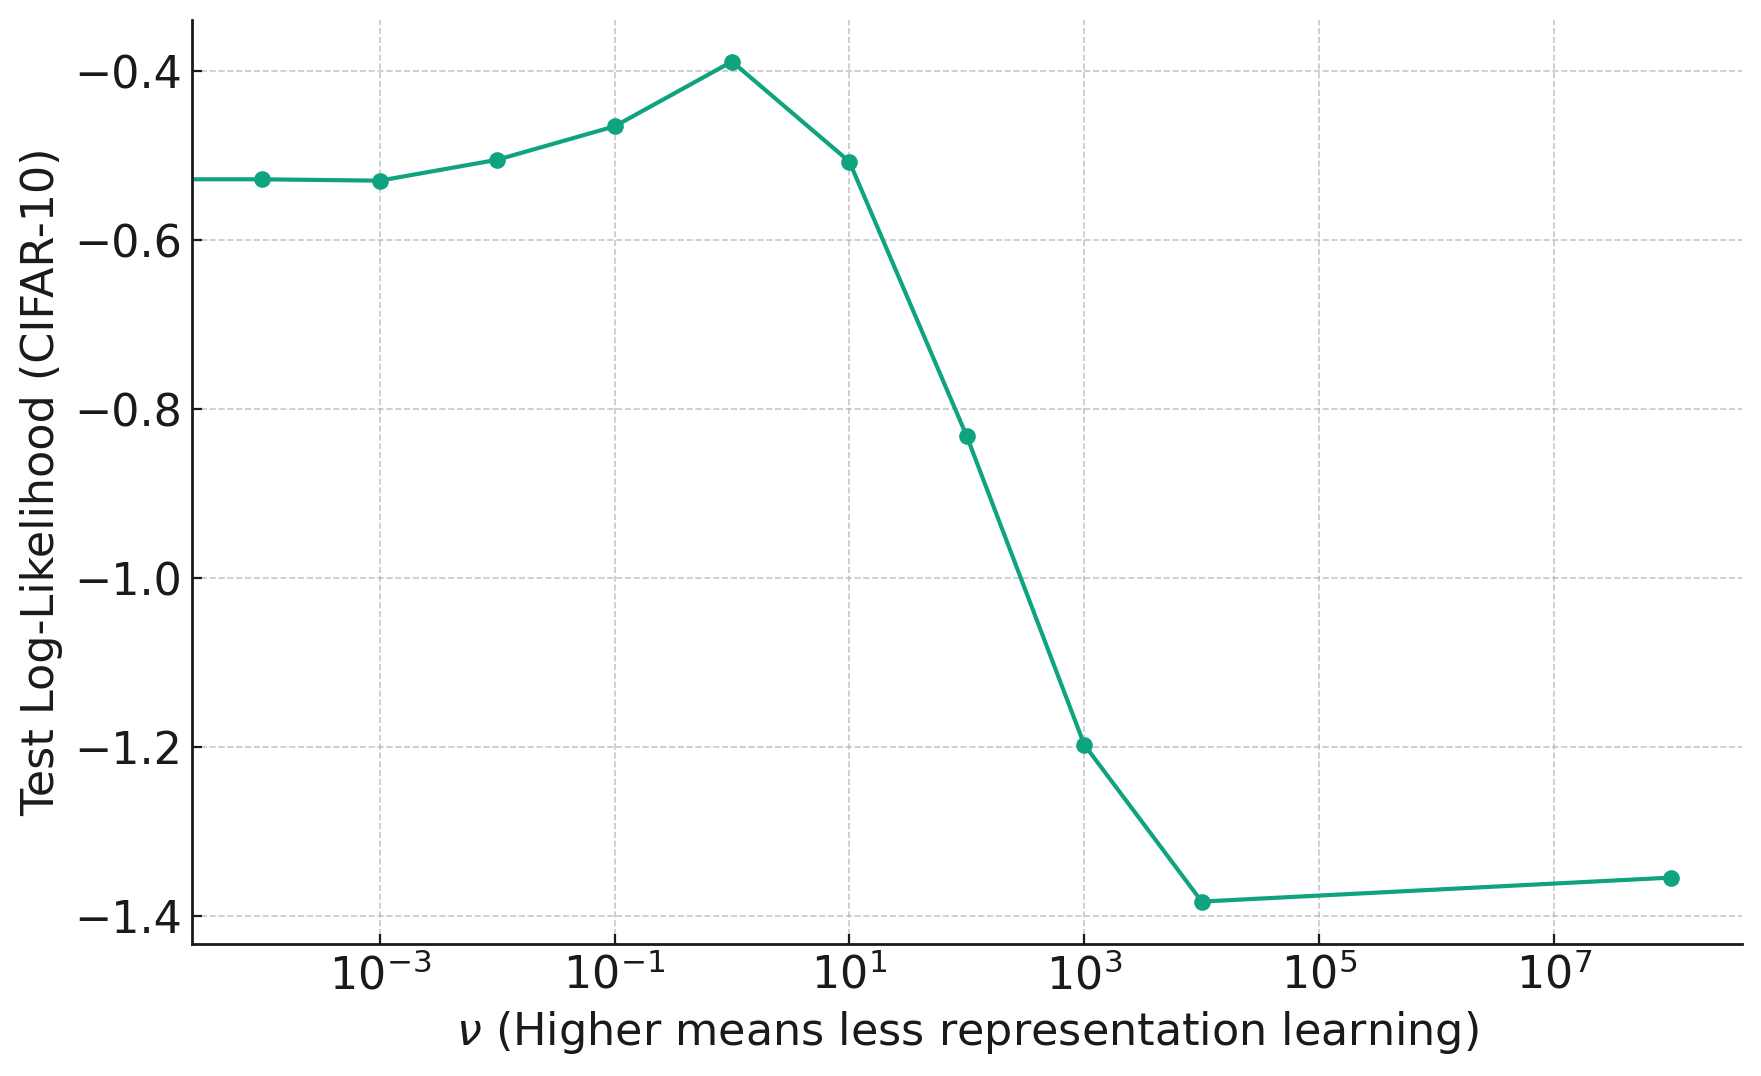
Ed and Ben: In this paper we explore the importance of representation learning in convolutional neural networks, specifically in the context of an infinite-width limit called the Neural Network Gaussian Process (NNGP) that is often used by theorists. Representation learning refers to the ability of models to learn a transformation of the data that is tailored to the task at hand. This is in contrast to algorithms that use a fixed transformation of the data, e.g. a support vector machine with a fixed kernel function like the RBF kernel. Representation learning is thought to be critical to the success of convolutional neural networks in vision tasks, but networks in the NNGP limit do not perform representation learning, instead transforming the data with a fixed kernel function. A recent modification to the NNGP limit, called the Deep Kernel Machine (DKM), allows one to gradually “add representation learning back in” to the NNGP, using a single hyperparameter that controls the amount of flexibility in the kernel. We extend this algorithm to convolutional architectures, which required us to develop a new sparse inducing point approximation scheme. This allowed us to test on the full CIFAR-10 image classification dataset, where we achieved state-of-the-art test accuracy for kernel methods, with 92.7%.

In the plot below, we see how changing the hyperparameter (x-axis) to reduce flexibility too much harms the performance on unseen data.


Student perspectives: Compass Annual Conference 2023

A post by Dominic Broadbent, PhD student on the Compass CDT, and Michael Whitehouse, PhD student of the Compass CDT (recently submitted thesis)

Introduction

September saw the second annual Compass Conference, hosted in the Fry Building, the home of the School of Mathematics. The event was particularly special as it is the first time that all five Compass cohorts were brought together, and it was a fantastic opportunity to celebrate the achievements and research of the Compass CDT with external partners.  This year the theme was “Communicating Research in Context“, focusing on how research can be better communicated, and the need to highlight the motivation and applications of mathematical research.

Research talks

The day began with four long form talks touching on the topic of communicating research. Starting with Alessio Zakaria’s talk which delved into Hypothesis tests, commenting on their criticial role as the defacto statistical tool across the sciences, and how p-hacking has led to a replication crisis that undermines public confidence in research. The next talk by Sam Stockman and Emerald Dilworth discussed the challenges they faced, and the key takeaways from their shared experience of communicating mathematics with researchers in the geographical sciences. Following this, Ed Davis’s interactive talk “The Universal Language of Visualisations” explored how effective visualisation techniques should differ by the intended audience, with examples from his research and activities outside of academia. The last talk by Dan Milner explored his research on understanding the effect of environmental factors on outcomes of smallholder farmers in Kenya. He took us through the process of collecting data on the ground, to modelling and communicating results to external partners.  After each talk there was an opportunity to ask questions, allowing for audience participation and the sparking of interesting discussions. The format mirrored that which is most frequently used in external academic conferences, giving the speakers a chance to practice their technique in front of friendly faces.

Lightning talks

After a short break, we jumped back into the fray with a series of 3-minute fast-paced lightning talks. A huge range of topics were covered, all the way from developing modelling techniques for the electric grid of the future, to predicting the incidence of Cerebral Vasospasm at the Southmead Hospital ICU. With such a short time to present, these talks were a great exercise in distilling research into just the essentials, knowing there is very limited time to garner the audience’s interest and convey an effective message.

Special guest lecture

After lunch, we reconvened to attend the special guest lecture. The talk, entitled Bridging the gap between research and industry, was delivered by Ruth Voisey, CEO of the Smith institute. It outlined Ruth’s journey from writing her PhD thesis ‘Multiple wave scattering by quasiperiodic structures’, to CEO of the Smith Institute – via an internship with the acoustic research team at Dyson. It was particularly refreshing to hear Ruth’s candid account of her ‘non-linear’ rise to CEO, accrediting her success to strong principles of clear research communication and ‘mathematical evangelicalism’.

As PhD students in the bubble of academia, the path to opportunities in the world of industry can often feel clouded – Ruth’s lecture painted a clear picture of how one can transition from university based research to a rewarding career outside of this bubble, applying such research to tangible problems in the real world. 

Panel discussion and poster session

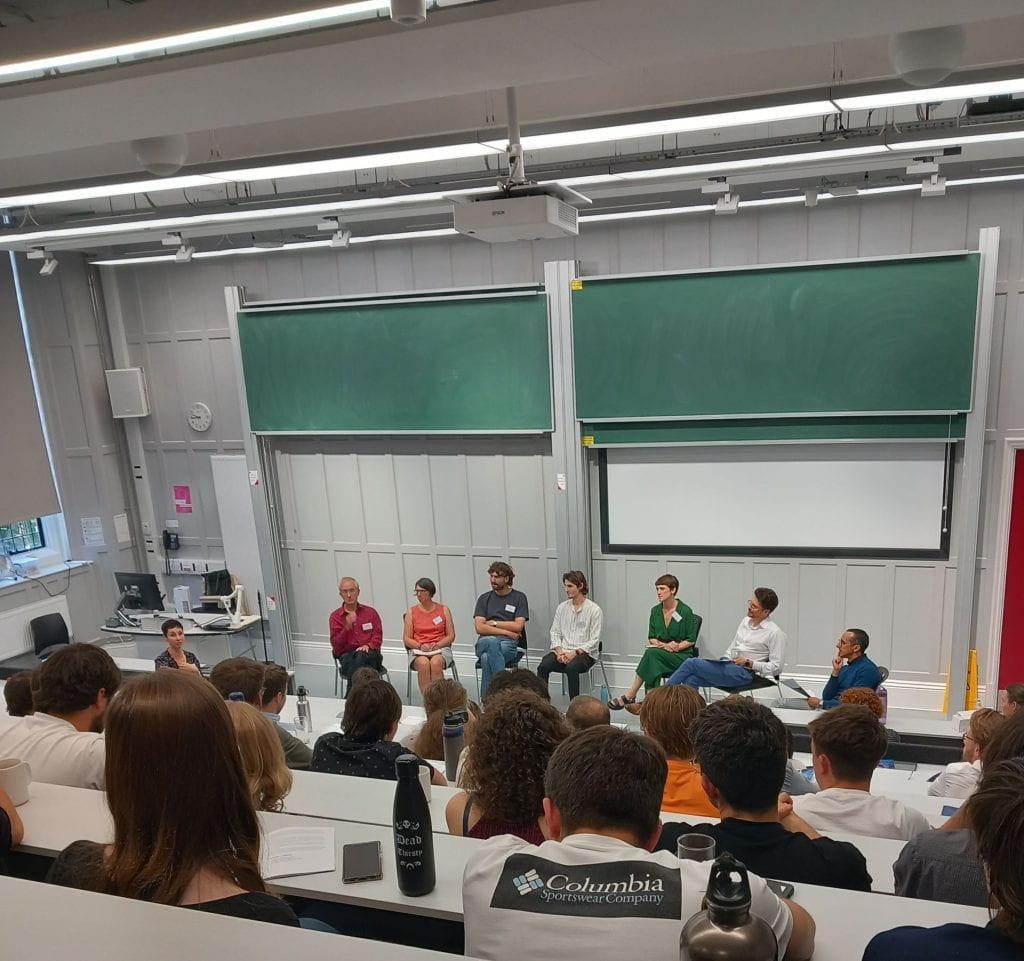
The special guest lecture was followed by a discussion on communicating research in context, with panel members Ruth Voisey, David Greenwood, Helen Barugh, Oliver Johnson, plus Compass CDT students Ed Davis and Sam Stockman. The panel discussed the difficulty of communicating the nuances of research conclusions with the public, with a particular focus on handling these nuances when talking to journalists – stressing the importance of communicating the limitations of the research in question.

This was followed by a poster session, one enthusiastic student had the following comment “it was great to see of all the Compass students’ hard work being celebrated and shared with the wider data science community”.

Concluding remarks

To cap off the successful event, Compass students Hannah Sansford and Josh Givens delivered some concluding remarks which were drawn from comments made by students about what key points they’d taken from the day. These focused on the importance of clear communication of research throughout the whole pipeline, from inception in discussion with fellow academics to the dissemination of knowledge to the general population.

The day ended with a walk to Goldney Hall, where students, staff, and attendees enjoyed delicious food, wine, and access to the beautiful Orangery gardens.

Compass students at AISTATS 2023

Congratulations to Compass students Josh Givens, Hannah Sansford and Alex Modell who, along with their supervisors have had their papers accepted to be published at AISTATS 2023.


‘Implications of sparsity and high triangle density for graph representation learning’

Hannah Sansford, Alexander Modell, Nick Whiteley, Patrick Rubin-Delanchy

Hannah: In this paper we explore the implications of two common characteristics of real-world networks, sparsity and triangle-density, for graph representation learning. An example of where these properties arise in the real-world is in social networks, where, although the number of connections each individual has compared to the size of the network is small (sparsity), often a friend of a friend is also a friend (triangle-density). Our result counters a recent influential paper that shows the impossibility of simultaneously recovering these properties with finite-dimensional representations of the nodes, when the probability of connection is modelled by the inner-product. We, by contrast, show that it is possible to recover these properties using an infinite-dimensional inner-product model, where representations lie on a low-dimensional manifold. One of the implications of this work is that we can ‘zoom-in’ to local neighbourhoods of the network, where a lower-dimensional representation is possible.

The paper has been selected for oral presentation at the conference in Valencia (<2% of submissions). 


Density Ratio Estimation and Neyman Pearson Classification with Missing Data

Josh Givens, Song Liu, Henry W J Reeve

Josh: In our paper we adapt the popular density ratio estimation procedure KLIEP to make it robust to missing not at random (MNAR) data and demonstrate its efficacy in Neyman-Pearson (NP) classification. Density ratio estimation (DRE) aims to characterise the difference between two classes of data by estimating the ratio between their probability densities. The density ratio is a fundamental quantity in statistics appearing in many settings such as classification, GANs, and covariate shift making its estimation a valuable goal. To our knowledge there is no prior research into DRE with MNAR data, a missing data paradigm where the likelihood of an observation being missing depends on its underlying value. We propose the estimator M-KLIEP and provide finite sample bounds on its accuracy which we show to be minimax optimal for MNAR data. To demonstrate the utility of this estimator we apply it the the field of NP classification. In NP classification we aim to create a classifier which strictly controls the probability of incorrectly classifying points from one class. This is useful in any setting where misclassification for one class is much worse than the other such as fault detection on a production line where you would want to strictly control the probability of classifying a faulty item as non-faulty. In addition to showing the efficacy of our new estimator in this setting we also provide an adaptation to NP classification which allows it to still control this misclassification probability even when fit using MNAR data.

Applications now open for PhD in Computational Statistics and Data Science

Start your PhD in Data Science now

Compass CDT is now recruiting for its fully funded places to start September 2023.

We are happy to announce that The University of Bristol online application system is open, and we are receiving applications for Compass CDT programme for September 2023 start. Early application is advised.

For 2023/34 entry, applicants must review the projects on offer. The projects are listed in the research section of our website. You will need to provide a Research Statement in your application documents with a ranked list of 3 projects of interest to you: 1 being the project of highest interest.

PhD Project Allocation Process

Application forms will be reviewed based on the 3 ranked projects specified. Successful applicants will be invited to attend an interview with the Compass admissions tutors and the specific project supervisor. If you are made an offer of PhD study it will be published through the online application system. You will then have 2 weeks to consider the offer before deciding whether to accept or decline.

The next review of applications for 2023 funded places will take place after

4 January 2023.

APPLY NOW

We welcome applications from all members of our community and are particularly encouraging those from diverse groups, such as members of the LGBT+ and black, Asian and minority ethnic communities, to join us.

Advantages of being a Compass Student

  • Stipend – a generous stipend of £21,668 pa tax free, paid in monthly payments. Plus your own expense budget of £1,000 pa towards travel and research activity.
  • No fees – all tuition fees are covered by the EPSRC and University of Bristol.
  • Bespoke training – first year units are designed specifically for the academic needs of each Compass student, which enables students to develop knowledge and capability to pursue cross-disciplinary PhD research.
  • Supervisors – supervisors from across academic disciplines offer a range of research projects.
  • Cohort – Compass students benefit from dedicated offices and collaboration spaces, enabling strong cohort links and opportunities for shared learning and research.

About Compass CDT

A 4-year bespoke PhD training programme in the statistical and computational techniques of data science, with partners from across the University of Bristol, industry and government agencies.

The cross-disciplinary programme offers exciting collaborations across medicine, computer science, geography, economics, life and earth sciences, as well as with our external partners who range from government organisations such as the Office for National Statistics, NCSC and the AWE, to industrial partners such as LV, Improbable, IBM Research, EDF, and AstraZeneca.

Students are co-located with the Institute for Statistical Science in the School of Mathematics, which occupies the Fry Building.

Hear from our students about their experience with the programme

  • Compass has allowed me to advance my statistical knowledge and apply it to a range of exciting applied projects, as well as develop skills that I’m confident will be highly useful for a future career in data science. – Shannon, Cohort 2

  • With the Compass CDT I feel part of a friendly, interactive environment that is preparing me for whatever I move on to next, whether it be in Academia or Industry. – Sam, Cohort 2

  • An incredible opportunity to learn the ever-expanding field of data science, statistics and machine learning amongst amazing people. – Danny, Cohort 1

APPLY BEFORE: 

Wednesday 4 January 2023, 5pm (London, UK time zone)

APPLY NOW

Video: The Data Science behind COVID Modelling

We are excited to share Dr Daniel Lawson’s (Compass CDT Co-Director) latest video where he will tell you about the Data Science behind Bristol’s COVID Modelling.

Mathematics has had a hidden role in predicting how we can best fight COVID-19. How is mathematics used with data science and machine learning? Why is modelling epidemics such a hard problem? How can we do it better next time? What will data science be able to do in the future, and how do you become a part of it?

Skip to toolbar