A post by Harry Tata, PhD student on the Compass programme.
Oligonucleotides in Medicine
Oligonucleotide therapies are at the forefront of modern pharmaceutical research and development, with recent years seeing major advances in treatments for a variety of conditions. Oligonucleotide drugs for Duchenne muscular dystrophy (FDA approved) [1], Huntington’s disease (Phase 3 clinical trials) [2], and Alzheimer’s disease [3] and amyotrophic lateral sclerosis (early-phase clinical trials) [4] show their potential for tackling debilitating and otherwise hard-to-treat conditions. With continuing development of synthetic oligonucleotides, analytical techniques such as mass spectrometry must be tailored to these molecules and keep pace with the field.
Working in conjunction with AstraZeneca, this project aims to advance methods for impurity detection and quantification in synthetic oligonucleotide mass spectra. In this blog post we apply a regularised version of the Richardson-Lucy algorithm, an established technique for image deconvolution, to oligonucleotide mass spectrometry data. This allows us to attribute signals in the data to specific molecular fragments, and therefore to detect impurities in oligonucleotide synthesis.
Oligonucleotide Fragmentation
If we have attempted to synthesise an oligonucleotide  with a particular sequence, we can take a sample from this synthesis and analyse it via mass spectrometry. In this process, molecules in the sample are first fragmented — broken apart into ions — and these charged fragments are then passed through an electromagnetic field. The trajectory of each fragment through this field depends on its mass/charge ratio (m/z), so measuring these trajectories (e.g. by measuring time of flight before hitting some detector) allows us to calculate the m/z of fragments in the sample. This gives us a discrete mass spectrum: counts of detected fragments (intensity) across a range of m/z bins [5].
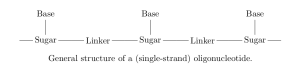
To get an idea of how much of is in a sample, and what impurities might be present, we first need to consider what fragments will produce. Oligonucleotides are short strands of DNA or RNA; polymers with a backbone of sugars (such as ribose in RNA) connected by linkers (e.g. a phosphodiester bond), where each sugar has an attached base which encodes genetic information [6].
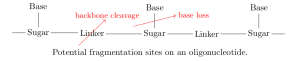
On each monomer, there are two sites where fragmentation is likely to occur: at the linker (backbone cleavage) or between the base and sugar (base loss). Specifically, depending on which bond within the linker is broken, there are four modes of backbone cleavage [7,8].
We include in  every product of a single fragmentation of — any of the four backbone cleavage modes or base loss anywhere along the nucleotide — as well as the results of every combination of two fragmentations (different cleavage modes at the same linker are mutually exclusive).
Sparse Richardson-Lucy Algorithm
Suppose we have a chemical sample which we have fragmented and analysed by mass spectrometry. This gives us a spectrum across n bins (each bin corresponding to a small m/z range), and we represent this spectrum with the column vector  , where
  is the intensity in the
  bin. For a set
  of possible fragments, let
  be the amount of
  that is actually present. We would like to estimate the amounts of each fragment based on the spectrum
  .
.
If we had a sample comprising a unit amount of a single fragment , so  and
and  and this produced a spectrum
  , we can say the intensity contributed to bin
  by is
by is  In mass spectrometry, the intensity in a single bin due to a single fragment is linear in the amount of that fragment, and the intensities in a single bin due to different fragments are additive, so in some general spectrum we have
By constructing a library matrix  such that
  (so the columns of
  correspond to fragments in ), then in ideal conditions the vector of fragment amounts
  solves
  . In practice this exact solution is not found — due to experimental noise and potentially because there are contaminant fragments in the sample not included in — and we instead make an estimate
  for which
  is close to .
Note that the columns of correspond to fragments in : the values in a single column represent intensities in each bin due to a single fragment only. We  -normalise these columns, meaning the total intensity (over all bins) of each fragment in the library matrix is uniform, and so the values in
  can be directly interpreted as relative abundances of each fragment.
The observed intensities — as counts of fragments incident on each bin — are realisations of latent Poisson random variables. Assuming these variables are i.i.d., it can be shown that the estimate of  which maximises the likelihood of the system is approximated by the iterative formula
}=\left(\mathbf A^T \frac{\mathbf b}{\mathbf{A\hat x}^{(t)}}\right)\odot \mathbf{\hat x}^{(t)}.")
Here, quotients and the operator  represent (respectively) elementwise division and multiplication of two vectors. This is known as the Richardson-Lucy algorithm [9].
In practice, when we enumerate oligonucleotide fragments to include in , most of these fragments will not actually be produced when the oligonucleotide passes through a mass spectrometer; there is a large space of possible fragments and (beyond knowing what the general fragmentation sites are) no well-established theory allowing us to predict, for a new oligonucleotide, which fragments will be abundant or negligible. This means we seek a sparse estimate, where most fragment abundances are zero.
The Richardson-Lucy algorithm, as a maximum likelihood estimate for Poisson variables, is analagous to ordinary least squares regression for Gaussian variables. Likewise lasso regression — a regularised least squares regression which favours sparse estimates, interpretable as a maximum a posteriori estimate with Laplace priors — has an analogue in the sparse Richardson-Lucy algorithm:
}=\left(\mathbf A^T \frac{\mathbf b}{\mathbf{A\hat x}^{(t)}}\right)\odot \frac{ \mathbf{\hat x}^{(t)}}{\mathbf 1 + \lambda},")
where  is a regularisation parameter [10].
Library Generation
For each oligonucleotide fragment  , we smooth and bin the m/z values of the most abundant isotopes of
  , and store these values in the columns of . However, if these are the only fragments in then impurities will not be identified: the sparse Richardson-Lucy algorithm will try to fit oligonucleotide fragments to every peak in the spectrum, even ones that correspond to fragments not from the target oligonucleotide. Therefore we also include ‘dummy’ fragments corresponding to single peaks in the spectrum — the method will fit these to non-oligonucleotide peaks, showing the locations of any impurities.
Results
For a mass spectrum from a sample containing a synthetic oligonucleotide, we generated a library of oligonucleotide and dummy fragments as described above, and applied the sparse Richardson-Lucy algorithm. Below, the model fit is plotted alongside the (smoothed, binned) spectrum and the ten most abundant fragments as estimated by the model. These fragments are represented as bars with binned m/z at the peak fragment intensity, and are separated into oligonucleotide fragments and dummy fragments indicating possible impurities. All intensities and abundances are Anscombe transformed ( ) for clarity.
As the oligonucleotide in question is proprietary, its specific composition and fragmentation is not mentioned here, and the bins plotted have been transformed (without changing the shape of the data) so that individual fragment m/z values are not identifiable.
We see the data is fit extremely closely, and that the spectrum is quite clean: there is one very pronounced peak roughly in the middle of the m/z range. This peak corresponds to one of the oligonucleotide fragments in the library, although there is also an abundant dummy fragment slightly to the left inside the main peak. Fragment intensities in the library matrix are smoothed, and it may be the case that the smoothing here is inappropriate for the observed peak, hence other fragments being fit at the peak edge. Investigating these effects is a target for the rest of the project.
We also see several smaller peaks, most of which are modelled with oligonucleotide fragments. One of these peaks, at approximately bin 5352, has a noticeably worse fit if excluding dummy fragments from the library matrix (see below). Using dummy fragments improves this fit and indicates a possible impurity. Going forward, understanding and quantification of these impurities will be improved by including other common fragments in the library matrix, and by grouping fragments which correspond to the same molecules.
References
[1] Junetsu Igarashi, Yasuharu Niwa, and Daisuke Sugiyama. “Research and Development of Oligonucleotide Therapeutics in Japan for Rare Diseases”. In: Future Rare Diseases 2.1 (Mar. 2022), FRD19.
[2] Karishma Dhuri et al. “Antisense Oligonucleotides: An Emerging Area in Drug Discovery and Development”. In: Journal of Clinical Medicine 9.6 (6 June 2020), p. 2004.
[3] Catherine J. Mummery et al. “Tau-Targeting Antisense Oligonucleotide MAPTRx in Mild Alzheimer’s Disease: A Phase 1b, Randomized, Placebo-Controlled Trial”. In: Nature Medicine (Apr. 24, 2023), pp. 1–11.
[4] Benjamin D. Boros et al. “Antisense Oligonucleotides for the Study and Treatment of ALS”. In: Neurotherapeutics: The Journal of the American Society for Experimental NeuroTherapeutics 19.4 (July 2022), pp. 1145–1158.
[5] Ingvar Eidhammer et al. Computational Methods for Mass Spectrometry Proteomics. John Wiley & Sons, Feb. 28, 2008. 299 pp.
[6] Harri Lönnberg. Chemistry of Nucleic Acids. De Gruyter, Aug. 10, 2020.
[7] S. A. McLuckey, G. J. Van Berkel, and G. L. Glish. “Tandem Mass Spectrometry of Small, Multiply Charged Oligonucleotides”. In: Journal of the American Society for Mass Spectrometry 3.1 (Jan. 1992), pp. 60–70.
[8] Scott A. McLuckey and Sohrab Habibi-Goudarzi. “Decompositions of Multiply Charged Oligonucleotide Anions”. In: Journal of the American Chemical Society 115.25 (Dec. 1, 1993), pp. 12085–12095.
[9] Mario Bertero, Patrizia Boccacci, and Valeria Ruggiero. Inverse Imaging with Poisson Data: From Cells to Galaxies. IOP Publishing, Dec. 1, 2018.
[10] Elad Shaked, Sudipto Dolui, and Oleg V. Michailovich. “Regularized Richardson-Lucy Algorithm for Reconstruction of Poissonian Medical Images”. In: 2011 IEEE International Symposium on Biomedical Imaging: From Nano to Macro. Mar. 2011, pp. 1754–1757.


 on some space
  with probability density functions (PDFs)
  respectively, the density ratio is the function
  defined by
:=\frac{p_0(z)}{p_1(z)}") .
.
 and
and  to estimate
  . What makes DRE so useful is that it gives us a way to characterise the difference between these 2 classes of data using just 1 quantity,
 ") and
and  by
by  . The task of predicting
  given
given  is then our standard classification problem. In classification a common target is the Bayes Optimal Classifier, the classifier
  which maximises
 ).") We can write this classifier in terms of
We can write this classifier in terms of =\mathbb{I}\{\mathbb{P}(Y=1|Z=z)>0.5\}") where
where  is the indicator function. Then, by the total law of probability, we have
=\frac{p_{Z|Y=1}(z)\mathbb{P}(Y=1)}{p_{Z|Y=1}(z)\mathbb{P}(Y=1)+p_{Z|Y=0}(z)\mathbb{P}(Y=0)}")
\mathbb{P}(Y=1)}{p_1(z)\mathbb{P}(Y=1)+p_0(z)\mathbb{P}(Y=0)} =\frac{1}{1+\frac{1}{r}\frac{\mathbb{P}(Y=0)}{\mathbb{P}(Y=1)}}.")
 , if
, if  is “close” to
  then
then  is a good estimate of
 ")
p_0(z)\mathrm{d}z=1")
") represent the KL divergence from
represent the KL divergence from  to
to  . The constraint ensures that the right hand side of our KL divergence is indeed a PDF. From the definition of the KL-divergence we can rewrite the solution to this as
 ![\hat r:=\frac{\tilde r}{\mathbb{E}[r(X^0)]}](https://s0.wp.com/latex.php?latex=%5Chat+r%3A%3D%5Cfrac%7B%5Ctilde+r%7D%7B%5Cmathbb%7BE%7D%5Br%28X%5E0%29%5D%7D&bg=ffffff&fg=000000&s=0 "\hat r:=\frac{\tilde r}{\mathbb{E}[r(X^0)]}") where
where  is the solution to the unconstrained optimisation
![\underset{r}{\text{min}}~\mathbb{E}[\log (r(Z^1))]-\log(\mathbb{E}[r(Z^0)]).](https://s0.wp.com/latex.php?latex=%5Cunderset%7Br%7D%7B%5Ctext%7Bmin%7D%7D%7E%5Cmathbb%7BE%7D%5B%5Clog+%28r%28Z%5E1%29%29%5D-%5Clog%28%5Cmathbb%7BE%7D%5Br%28Z%5E0%29%5D%29.&bg=ffffff&fg=000000&s=2 "\underset{r}{\text{min}}~\mathbb{E}[\log (r(Z^1))]-\log(\mathbb{E}[r(Z^0)]).")
 from
from  and samples
  from
from  our estimate of the density ratio will be
 \right)^{-1}\tilde r") where
where )-\log\left(\frac{1}{n}\sum_{i=1}^n r(z^0_i)\right).")
 . We assume that
 =1") so that either
so that either =\varphi(z)") with
with ") not constant and refer to
not constant and refer to  as the missingness function. This type of missingness is known as missing not at random (MNAR) and when dealt with improperly can lead to biased result. Some examples of MNAR data could be readings take from a medical instrument which is more likely to err when attempting to read extreme values or recording responses to a questionnaire where respondents may be more likely to not answer if the deem their response to be unfavourable. Note that while we do not see what the true response would be, we do at least get a response meaning that we know when an observation is missing.
 we observe samples from their corrupted versions
  . We take their respective missingness functions to be
  and assume them to be known. Now let us look at what would happen if we implemented KLIEP with the data naively by simply filtering out the missing-values. In this case, the actual density ratio we would be estimating would be
:=\frac{p_{X_1|X_1\neq\varnothing}(z)}{p_{X_0|X_o\neq\varnothing}(z)}\propto\frac{(1-\varphi_1(z))p_1(z)}{(1-\varphi_0(z))p_0(z)}\not{\propto}r^*(z)")
 are more likely to be missing when larger and class
  has no missingness.
![\mathbb{E}[g(Z)]=\mathbb{E}\left[\frac{\mathbb{I}\{X\neq\varnothing\}g(X)}{1-\varphi(X)}\right].](https://s0.wp.com/latex.php?latex=%5Cmathbb%7BE%7D%5Bg%28Z%29%5D%3D%5Cmathbb%7BE%7D%5Cleft%5B%5Cfrac%7B%5Cmathbb%7BI%7D%5C%7BX%5Cneq%5Cvarnothing%5C%7Dg%28X%29%7D%7B1-%5Cvarphi%28X%29%7D%5Cright%5D.&bg=ffffff&fg=000000&s=2 "\mathbb{E}[g(Z)]=\mathbb{E}\left[\frac{\mathbb{I}\{X\neq\varnothing\}g(X)}{1-\varphi(X)}\right].")
 from
from  and samples
  from
from  our estimate is
 }{1-\varphi_o(x_i^o)}\right)^{-1}\tilde r") where
where )}{1-\varphi_1(x_i^1)}-\log\left(\frac{1}{n}\sum_{i=1}^n\frac{\mathbb{I}\{x_i^0\neq\varnothing\}r(x_i^0)}{1-\varphi_0(x_i^0)}\right).")
 .
.


 . That is, the dimension of the embeddings (
 ) is much smaller than the number of items or users. The hope is that the position of these embeddings captures some of the latent (hidden) structure of the items/users, and so similar items end up ‘close together’ in the embedding space. What is meant by being ‘close’ may be specified by some similarity measure.
 users
users ") and a group of
and a group of  items
items ") . Then we let
. Then we let  be the ratings matrix where position
  represents whether user
  interacts with item
  is very sparse, since most users only interact with a small subset of the full item set
  . For any items
  , and item embeddings,
  , is Matrix Factorisation. The idea is to find low-rank embeddings such that the product
  is a good approximation to the ratings matrix
  = \sum_{u, i} \left(R_{ui} - \langle X_u, Y_i \rangle \right)^2.")
 .
. and
and  , we can look at the row of
  , i.e.
,")
 and
and  ,
,}{1 + \exp(\langle X_u, Y_i \rangle + \beta_u + \beta_i)} \right).")